Weekly Market Commentary - Feb 21, 2026 - Click Here for Past Commentaries
-
For the week ending Friday, February 20, 2026, the U.S. stock market finished with modest gains,
rebounding from a volatile start to the year. A major relief rally on Friday, triggered by a U.S.
Supreme Court ruling that struck down sweeping tariffs, helped push the major indexes into positive
territory for the week.
Key Market Drivers
Supreme Court Tariff Ruling: In a 6-3 decision, the Court ruled that the administration exceeded its authority by imposing broad tariffs under emergency powers. This sparked a sharp "relief rally" on Friday, particularly benefiting trade-exposed sectors like transportation and retail.
Inflation & GDP Data: The week saw mixed economic signals. The Core PCE (the Fed's preferred inflation gauge) rose 0.4% in December, higher than the 0.2% expected, which initially pressured stocks. Additionally, Q4 2025 GDP grew at a slower-than-anticipated 1.4% annualized rate.
Tech Rebound: After five consecutive weekly declines, the Nasdaq snapped its losing streak, led by a rotation back into mega-cap growth names and continued AI infrastructure enthusiasm, such as Meta's reported $135 billion investment plan.
Commodities & Yields: U.S. crude oil prices jumped nearly 6% for the week to over $66 per barrel, driven by escalating tensions in the Middle East. The 10-year Treasury yield edged up slightly to finish the week at 4.08%.
1. Technology: The Relief Rally
After five weeks of declines, tech shares rebounded on Friday. The U.S. Supreme Court struck down broad tariffs, providing immediate cost relief for hardware manufacturers reliant on global supply chains.
Meta Platforms (+1.69%): Outperformed the sector after announcing a $50 billion deal with NVIDIA to secure Blackwell and Rubin chips.
Infrastructure Shift: Investors are pivoting from "AI software" (down ~20% YTD) toward "tangible AI" like chips and networking.
2. Energy: The 2026 Leader
Despite a slower weekly gain of +0.45%, Energy remains the undisputed market leader of 2026.
Rotation into Value: High-concentration tech selling has fueled a rotation into "real assets".
Data Center Demand: Analysts at State Street (XLE) attribute the surge to the massive energy requirements of AI data centers and geopolitical tensions in Venezuela and Iran.
Cost Relief: The tariff ruling also benefits energy firms by lowering the cost of imported modules for LNG plants and drilling equipment.
3. The $50 Billion Meta-NVIDIA Alliance
The "deeper" story in tech is the transition from buying individual chips to full-stack integration.
First-of-its-kind: Meta is the first hyperscaler to deploy NVIDIA Grace CPUs as standalone chips at scale, moving away from Intel/AMD dominance.
Capex Explosion: Meta's projected 2026 capital expenditure of $115B–$135B is nearly double its 2024 levels, signaling an "all-in" bet on personal superintelligence.
4. Semiconductors: The "Iron Floor"
The semiconductor industry is on track to reach $1 trillion in annual sales in 2026.
Infrastructure Boom: Demand for AI accelerators (NVIDIA GPUs), High-Bandwidth Memory (HBM), and networking gear remains "insane".
Concentrated Gains: Growth is highly top-heavy; the top three chip stocks now account for 80% of the top 10's total market cap.
Valuation Premium: Unlike software, chips enjoy a valuation premium as investors prioritize tangible AI infrastructure.
5. Software: The "SaaSpocalypse"
Software stocks have been "hammered" in 2026 due to fears that AI might disrupt traditional business models rather than enhance them.
Monetization Jitters: Investors are questioning the speed of AI software returns, leading to a sharp correction in SaaS provider valuations.
Efficiency Gains vs. Revenue: New, low-cost AI models from competitors like DeepSeek and Anthropic have sparked fears of diminishing returns for traditional "brute-force" compute software.
Opportunity: Some analysts, including Barron's, suggest the sub-sector is finally stabilizing, noting that current prices may represent an attractive "buy the dip" entry point.
Week Ahead (February 23–27, 2026)
The coming week is set to be one of the most consequential periods of the year for the stock market. Investors will navigate a high-stakes "triple threat" of NVIDIA earnings, a potential geopolitical escalation in the Middle East, and the fallout from a landmark Supreme Court ruling on tariffs.
1. The Main Event: NVIDIA Earnings (Wednesday, Feb 25)
NVIDIA’s report is being hailed as the "moment of truth" for the AI trade.
What to watch: Beyond the numbers, markets are looking for verification of the $50 billion Meta partnership and any guidance on the upcoming Rubin and Vera platforms.
Sector Impact: This will set the tone for the entire semiconductor and enterprise software complex, which has been under pressure from "AI fatigue".
2. Geopolitical & Policy Volatility
Iran Tensions: Oil prices spiked 5.7% last week following warnings of a potential limited military strike on Iran within "10 to 15 days". Expect continued volatility in the Energy sector and defense stocks.
Tariff Tug-of-War: While the Supreme Court struck down broad tariffs on Friday, the administration has already signaled a move toward a new 10% "global tariff" using alternative legal powers. Trade-sensitive sectors like Transportation and Retail will remain on edge.
3. Key Economic Reports & Fed Speakers
The Federal Reserve's path remains the biggest macro question after January's "hawkish" meeting minutes.
Fed Speakers: Watch for comments from Chair Powell and other FOMC members, as markets will be looking for any hints of a shift in the Fed's stance on interest rates.
Economic Data: Key reports include the February Consumer Price Index (CPI) and the University of Michigan Consumer Sentiment Index, both due on Friday. These will provide critical insights into inflation trends and consumer confidence heading into the second quarter.
4. Major Earnings to Watch While NVIDIA dominates the headlines, several other heavyweights will provide a pulse check on the consumer and enterprise tech:
Retail: Home Depot, Lowe’s, TJX Companies.
Enterprise Software: Salesforce, Workday, Snowflake, Intuit.
Tech/Other: Dell, Berkshire Hathaway (annual report), Baidu.
Market Sentiment Note: The S&P 500's implied move for next week is currently +/- 2%, which is higher than normal, suggesting traders are bracing for significant swings.
-
Final Words: Market indicates Greed. No New Buys
CNN Market indicates fear.
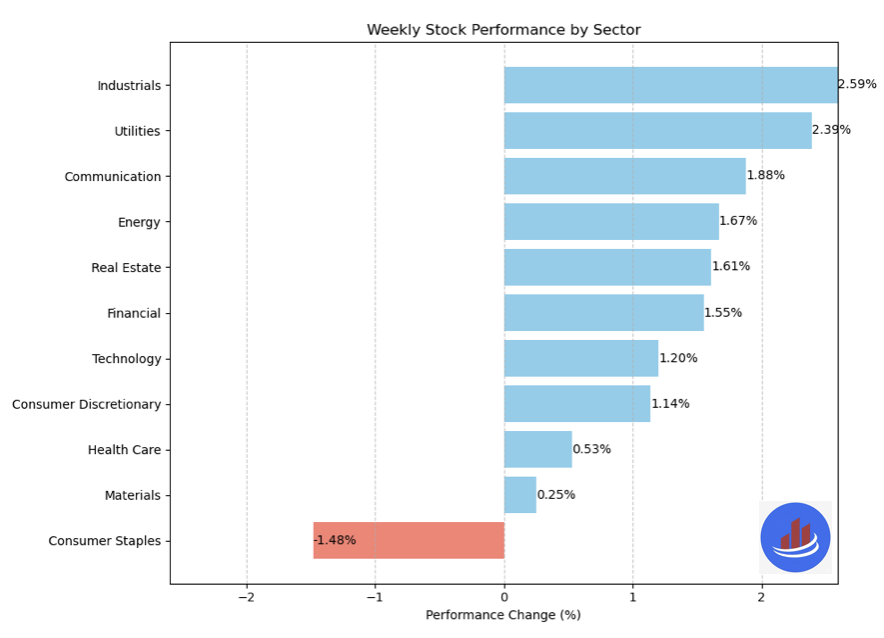
Weekly Sector Performance for Feb 16-20, 2026: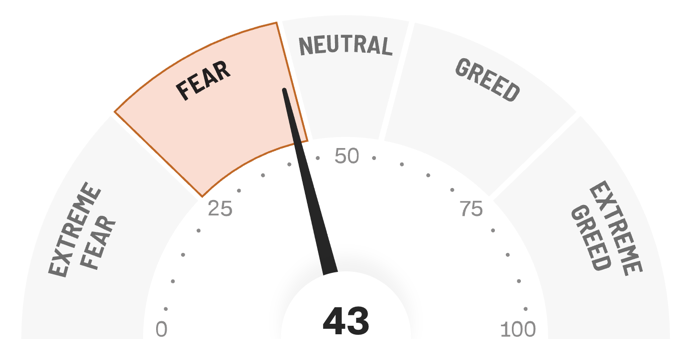
$XLE Energy: 1.67%, RSI: 69.38
$XLK Technology: 1.20%, RSI: 46.37
$XLC Communication: 1.88%, RSI: 52.20
$XLY Consumer Discretionary: 1.14%, RSI: 43.35
$XLP Consumer Staples: -1.48%, RSI: 66.33
$XLF Financial: 1.55%, RSI: 43.73
$XLV Health Care: 0.53%, RSI: 52.03
$XLI Industrials: 2.59%, RSI: 74.06
$XLB Materials: 0.25%, RSI: 65.26
$XLRE Real Estate: 1.61%, RSI: 66.17
$XLU Utilities: 2.39%, RSI: 69.86
If you are looking for investment opportunities, you can take a look at our
Hidden Gems
section, and if you want to see our past performance, visit our
Past Performance section. If you are looking for
safe and low cost Exchange Traded funds(ETFs), check out our
ETF recommendations.
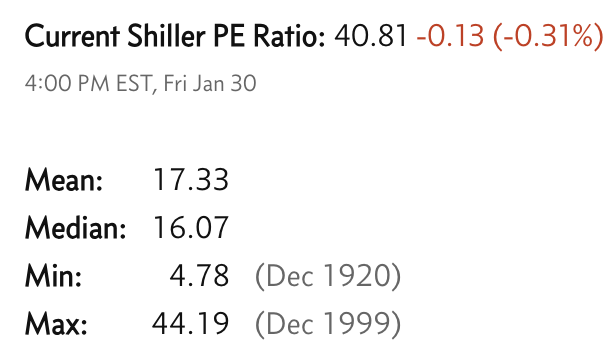
Currrent Shiller PE (see below) is showing overbought conditions as index is far above mean/media
and our AryaFin engine is indicating caution. Have a good weekend.