Price/Earnings (PE) Ratio
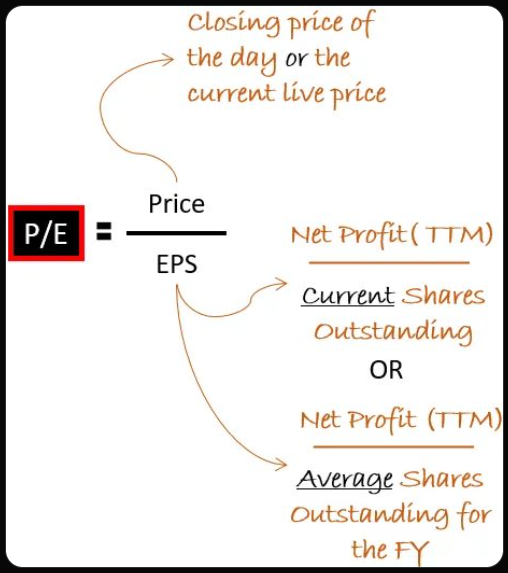
At a basic level, a price earnings (P/E) ratio is a way to measure how expensive a company's shares are. By dividing the share price, or market value, of a company's stock by its annual earnings per share, you end up with a figure that represents the amount of money you are paying for each dollar of its earnings.
Forward Price/Earnings (FPE) Ratio
The forward P/E ratio (or forward price-to-earnings ratio) divides the current share price of a company by the estimated future (“forward”) earnings per share (EPS) of that company.
Trailing Price/Earnings (TPE) Ratio
Trailing P/E is calculated by dividing the current market value, or share price, by the earnings per share over the previous 12 months. The forward P/E ratio estimates a company's likely earnings per share for the next 12 months.
Price/Book (PB) Ratio
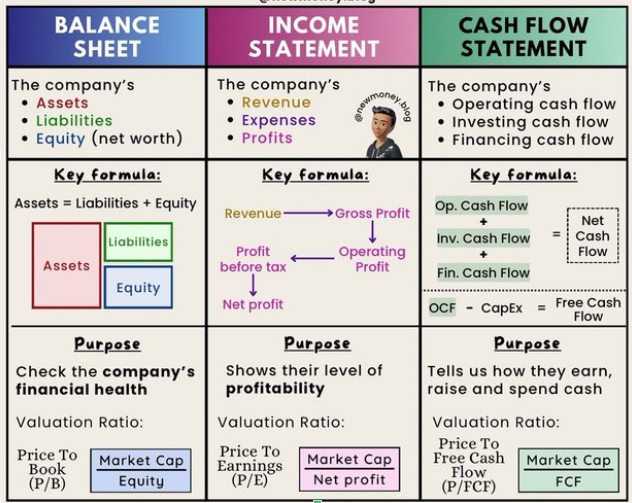
The price to book ratio (P/B) is calculated by dividing a company's market capitalization by its book value of equity as of the latest reporting period. Or, alternatively, the P/B ratio can also be calculated by dividing the latest closing share price of the company by its most recent book value per share.
Price/Sales (PS) Ratio
The Price to Sales ratio, also known as the P/S ratio, is a formula used to measure the total value that investors place on the company in comparison to the total revenue generated by the business. It is calculated by dividing the share price by the sales per share.
Price/Earnings-to-Growth (PEG) Ratio
The price/earnings to growth ratio (PEG ratio) is a stock's price-to-earnings (P/E) ratio divided by the growth rate of its earnings for a specified time period. The PEG ratio is used to determine a stock's value while also factoring in the company's expected earnings growth, and it is thought to provide a more complete picture than the more standard P/E ratio.
Price to Free Cash Flow Ratio (P/FCF)
The Price to Free Cash Flow Ratio, or P / FCF Ratio, values a company against its Free Cash Flow. It is the Share Price of the company divided by its Free Cash Flow per Share.
Current Ratio (CR) - Liquidity Ratio
The current ratio measures a company’s ability to pay off short-term liabilities with current assets:
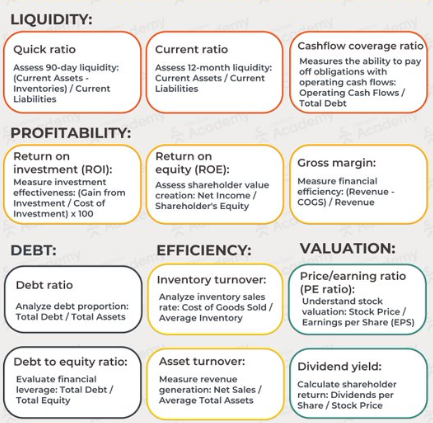
Current ratio = Current assets / Current liabilities
Acid-test Ratio (ATR) - Liquidity Ratio
The acid-test ratio measures a company’s ability to pay off short-term liabilities with quick assets:
Acid-test Ratio = Current assets – Inventories / Current liabilities
Cash Ratio (CaR) - Liquidity Ratio
The cash ratio measures a company’s ability to pay off short-term liabilities with cash and cash equivalents:
Cash Ratio = Cash and Cash equivalents / Current Liabilities
Operating Cash Flow Ratio - Liquidity Ratio
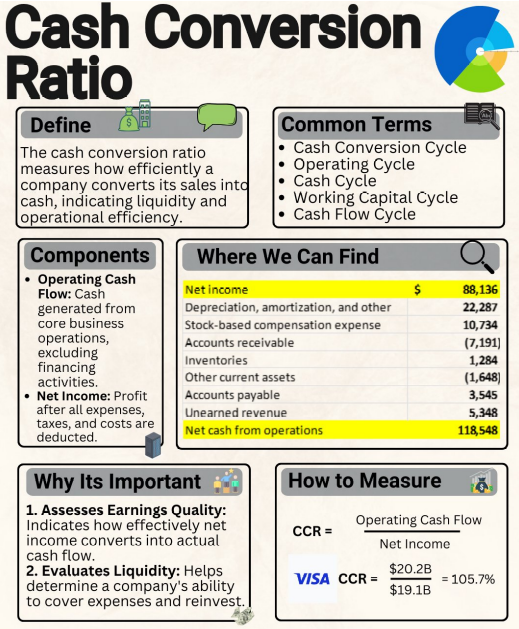
The operating cash flow ratio is a measure of the number of times a company can pay off current liabilities
with the cash generated in a given period:
Operating Cash Flow Ratio = Operating cash flow / Current liabilities
Leverage Financial Ratios
Leverage ratios measure the amount of capital that comes from debt. In other words, leverage
financial ratios are used to evaluate a company’s debt levels.
Debt Ratio - Leverage Financial
The debt ratio measures the relative amount of a company’s assets that are provided from debt:
Debt Ratio = Total liabilities / Total assets
Debt to Equity Ratio - Leverage Financial
The debt to equity ratio calculates the weight of total debt and financial liabilities against shareholders’ equity:
Debt to equity ratio = Total liabilities / Shareholder’s equity
Interest Coverage Ratio - Leverage Financial
The interest coverage ratio shows how easily a company can pay its interest expenses:
Interest coverage ratio = Operating income / Interest expenses
Debt Service Coverage Ratio - Leverage Financial
The debt service coverage ratio reveals how easily a company can pay its debt obligations:
Debt service coverage ratio = Operating income / Total debt service
Debt-to-EBITDA Ratio - Leverage Financial
Debt-to-EBITDA tells about debt in relation with depreciation & amortization of assets.
Debt-to-EBITDA = Total Debt / Earnings Before Interest Taxes Depreciation & Amortization (EBITDA)
Debt-to-Capita Ratio - Leverage Financial
Debt-to-Capital tells about debt in relation with total capital.
Debt-to-Capital = Today Debt / (Total Debt + Total Equity)
Efficiency Ratios
Efficiency ratios, also known as activity financial ratios, are used to measure how well a company is utilizing its assets and resources.
Asset Turnover Ratio - Efficiency Ratio
The asset turnover ratio measures a company’s ability to generate sales from assets:
Asset turnover ratio = Net sales / Average total assets
Inventory Turnover Ratio - Efficiency Ratio
The inventory turnover ratio measures how many times a company’s inventory is sold and replaced over a given period:
Inventory turnover ratio = Cost of goods sold / Average inventory
Receivables Turnover Ratio - Efficiency Ratio
The accounts receivable turnover ratio measures how many times a company can turn receivables into cash over a given period:
Receivables turnover ratio = Net credit sales / Average accounts receivable
Days Sales in Inventory Ratio - Efficiency Ratio
The days sales in inventory ratio measures the average number of days that a company holds on
to inventory before selling it to customers:
Days sales in inventory ratio = 365 days / Inventory turnover ratio
Profitability Ratios
Profitability ratios measure a company’s ability to generate income relative to revenue,
balance sheet assets, operating costs, and equity.
Gross Margin(GM) Ratio - Profitability Ratio
The gross margin ratio compares the gross profit of a company to its net sales
to show how much profit a company makes after paying its cost of goods sold:
Gross Margin ratio = Gross profit / Net sales
Operating Margin(OM) Ratio - Profitability Ratio
The operating margin ratio, sometimes known as the return on sales ratio, compares
the operating income of a company to its net sales to determine operating efficiency:
Operating Margin ratio = Operating income / Net sales
Net Profit Margin (PM) Ratio - Profitability Ratio
Net profit is calculated by deducting all company expenses from its total revenue.
The result of the profit margin calculation is a percentage:
Net Profit Margin = Net Profit ⁄ Total Revenue x 100
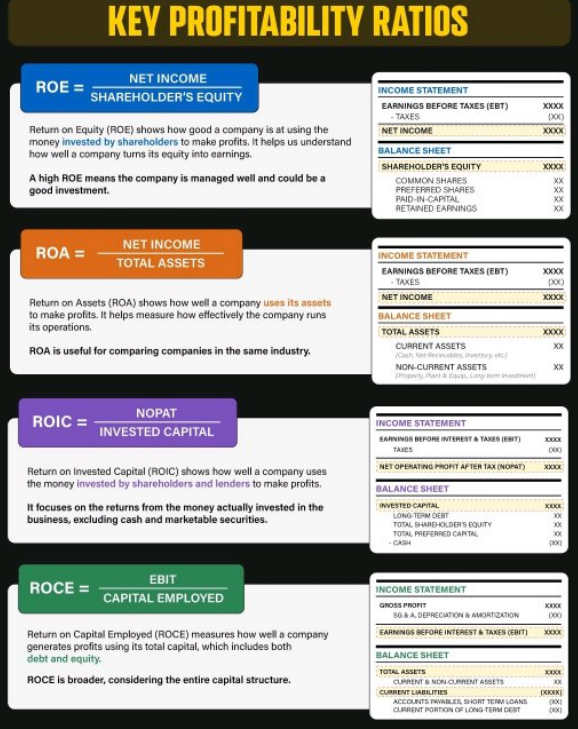
Return on Assets(ROA) Ratio - Profitability Ratio
The return on assets ratio measures how efficiently a company is using its assets to generate profit:
Return on Assets ratio = Net income / Total assets
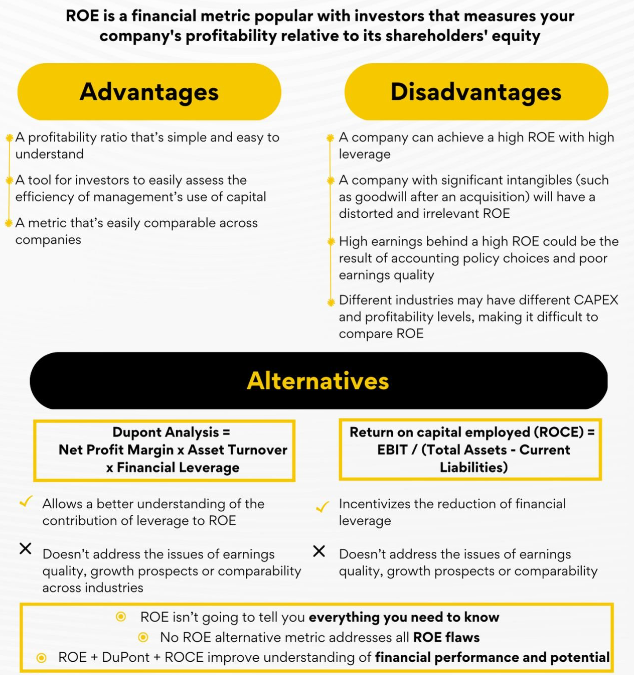
Return on Equity(ROE) Ratio - Profitability Ratio
The return on equity ratio measures how efficiently a company is using its equity to generate profit:
Return on Equity ratio = Net income / Shareholder’s equity
Return on investment (ROI) Ratio - Profitability Ratio
Return on investment (ROI) is an approximate measure of an investment's profitability.
ROI is calculated by subtracting the initial cost of the investment from its final value,
then dividing this new number by the cost of the investment, and finally, multiplying it by 100:
Return on investment (ROI) ratio = ( (Final Value - Cost of the Investment) / Cost of the Investment)*100
Book Value / Share - Market Value Ratio
The book value per share ratio calculates the per-share value of a company based on the equity available to shareholders:
Book value per share ratio = (Shareholder’s equity – Preferred equity) / Total common shares outstanding
Dividend Yield - Market Value Ratio
The dividend yield ratio measures the amount of dividends attributed to shareholders relative to the market value per share:
Dividend yield ratio = Dividend per share / Share price
Earnings / share (EPS) - Market Value Ratio
The earnings per share ratio measures the amount of net income earned for each share outstanding:
Earnings per share ratio = Net earnings / Total shares outstanding
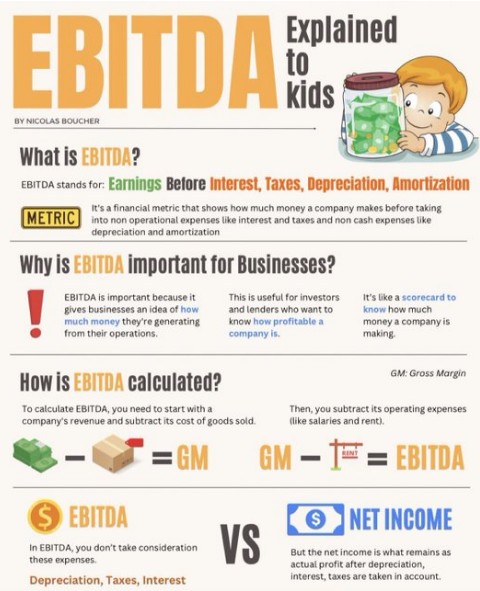
EBITDA
EBITDA stands for Earnings Before Interest, Taxes, Depreciation, and Amortization and is a metric used to evaluate a company’s operating performance. It can be seen as a loose proxy for cash flow from the entire company’s operations. The EBITDA metric is a variation of operating income (EBIT) that excludes certain non-cash expenses. The purpose of these deductions is to remove the factors that business owners have discretion over, such as debt financing, capital structure, methods of depreciation, and taxes (to some extent). It can be used to showcase a firm’s financial performance without the impact of its capital structure. EBITDA is not a recognized metric in use by IFRS or US GAAP, as it does not account for the depreciation of a company’s assets.
EV/EBITDA Ratio
EV/EBITDA is a ratio that compares a company's Enterprise Value (EV) to its Earnings Before Interest, Taxes, Depreciation & Amortization (EBITDA). The EV/EBITDA ratio is commonly used as a valuation metric to compare the relative value of different businesses.
Discounted cash flow (DCF)
Discounted cash flow (DCF) refers to a valuation method that estimates the value of an investment using its expected future cash flows. DCF analysis attempts to determine the value of an investment today, based on projections of how much money that investment will generate in the future.
Relative Strength Index (RSI)
The relative strength index (RSI) is a momentum indicator used in technical analysis. RSI measures the speed and magnitude of a security's recent price changes to evaluate overvalued or undervalued conditions in the price of that security. The RSI can do more than point to overbought and oversold securities. It can also indicate securities that may be primed for a trend reversal or corrective pullback in price. It can signal when to buy and sell. Traditionally, an RSI reading of 70 or above indicates an overbought situation. A reading of 30 or below indicates an oversold condition.
Beta (β)
Beta (β) is the second letter of the Greek alphabet used in finance to denote the volatility or systematic risk of a security or portfolio compared to the market, usually the S&P 500 which has a beta of 1.0. Stocks with betas higher than 1.0 are interpreted as more volatile than the S&P 500.
Graham's Number
The Graham's number (or Benjamin Graham's number) measures a stock's fundamental
value by taking into account the company's earnings per share (EPS) and book
value per share (BVPS). The Graham number is the upper bound of the price range
that a defensive investor should pay for the stock. According to the theory,
any stock price below the Graham number is considered undervalued and thus
worth investing in. Graham's belief that the price-to-earnings (P/E) ratio
should not be over 15x and the price-to-book ratio should not be over
1.5x (thus, 15 x 1.5 = 22.5).
The Formula for Graham Number = sqrt(22.5 x EPS x BVPS)
Assets Under Management (AUM)
Assets under management (AUM) is the market value of the investments managed by a person or entity on behalf of clients. AUM is used in conjunction with management performance and management experience when evaluating a company. When calculating AUM, some financial institutions include bank deposits, mutual funds, and cash, while others limit it to funds under discretionary management from individual investors.
Levered Free Cash Flow (LFCF)
Levered free cash flow (LFCF) is the amount of money that a company has left remaining after paying all of its financial obligations. LFCF is the amount of cash that a company has after paying debts, while unlevered free cash flow (UFCF) is cash before debt payments are made. Levered free cash flow is important because it is the amount of cash that a company can use to pay dividends and make investments in the business.
Accounts Payable (AP)
Accounts payable (AP) is a short-term debt and a liability on a balance sheet where a business owes money to its vendors/suppliers that have provided the business with goods or services on credit.
Accounts Receivable (AR)
Accounts receivable (AR) is the balance of money due to a firm for goods or services delivered or used but not yet paid for by customers. Accounts receivable is listed on the balance sheet as a current asset. Any amount of money owed by customers for purchases made on credit is AR.
Average Revenue Per User (ARPU)
The Average Revenue Per User (ARPU) quantifies the amount of revenue generated on average from each customer. The implied ARPU can be calculated by dividing the total amount of revenue generated by the company by the total number of users (i.e. customers).
Average Selling Price (ASP)
Average selling price (ASP) is the amount of money a product in a specific category is sold for across different markets and channels. To calculate the average selling price of a product, take the total revenue earned from the product or service and divide it by the number of products or services sold.
Bill of Materials (BOM)
A bill of materials (BOM) is an extensive list of raw materials, components, and instructions required to construct, manufacture, or repair a product or service. It lists the finished product at the top, followed by individual components and materials. Engineering BOMs are used in the design process while manufacturing BOMs are used in the assembly process.
Compound Annual Growth Rate (CAGR)
The compound annual growth rate (CAGR) is the mean annual growth rate of an investment over a period longer than one year. It's one of the most accurate ways to calculate and determine returns for individual assets, investment portfolios, and anything that can rise or fall in value over time.
Capital Expenditures (CapEx)
Capital expenditures (CapEx) are funds used by a company to acquire, upgrade, and maintain physical assets such as property, plants, buildings, technology, or equipment. CapEx is often used to undertake new projects or investments by a company. Making capital expenditures on fixed assets can include repairing a roof if the useful life of the roof is extended, purchasing a piece of equipment, or building a new factory.
Operating Expense (OpEx)
An operating expense is an expense that a business incurs through its normal business operations. Often abbreviated as OpEx, operating expenses include rent, equipment, inventory costs, marketing, payroll, insurance, and funds allocated for research and development.
Capital Asset Pricing Model (CAPM)
The capital asset pricing model, or CAPM, is a financial model that calculates the expected rate of return for an asset or investment. CAPM does this by using the expected return on both the market and a risk-free asset, and the asset's correlation or sensitivity to the market (beta).
Credit Default Swap (CDS)
A credit default swap (CDS) is a contract between two parties in which one party purchases protection from another party against losses from the default of a borrower for a defined period of time.
Cost of Capital (COC)
Cost of capital is a calculation of the minimum return that would be necessary in order to justify undertaking a capital budgeting project, such as building a new factory. It is an evaluation of whether a projected decision can be justified by its cost. Many companies use a combination of debt and equity to finance business expansion. For such companies, the overall cost of capital is derived from the weighted average cost of all capital sources. This is known as the weighted average cost of capital (WACC).
Cash on Delivery (COD)
Cash on delivery (COD) is a type of transaction where the recipient pays for a good at the time of delivery rather than using credit. The terms and accepted forms of payment vary according to the payment provisions of the purchase agreement. Cash on delivery is also referred to as “collect on delivery” since delivery may allow for cash, check, or electronic payment.
Cost of Goods Sold (COGS)
Cost of goods sold (COGS) refers to the direct costs of producing the goods sold by a company. This amount includes the cost of the materials and labor directly used to create the good. It excludes indirect expenses, such as distribution costs and sales force costs. Cost of goods sold is also referred to as "cost of sales."
Consumer Price Index (CPI)
The Consumer Price Index (CPI) measures the monthly change in prices paid by U.S. consumers. The Bureau of Labor Statistics (BLS) calculates the CPI as a weighted average of prices for a basket of goods and services representative of aggregate U.S. consumer spending. The CPI is one of the most popular measures of inflation and deflation. The CPI report uses a different survey methodology, price samples, and index weights than the producer price index (PPI), which measures changes in the prices received by U.S. producers of goods and services.
Producer Price Index (PPI)
The Producer Price Index (PPI) measures the average change over time in the prices domestic producers receive for their output. It is a measure of inflation at the wholesale level that is compiled from thousands of indexes measuring producer prices by industry and product category. The index is published monthly by the U.S. Bureau of Labor Statistics (BLS). The PPI is different from the consumer price index (CPI), which measures the changes in the price of goods and services paid by consumers.
Generally Accepted Accounting Principles (GAAP)
Generally accepted accounting principles, or GAAP, are standards that encompass the details, complexities, and legalities of business and corporate accounting. The Financial Accounting Standards Board (FASB) uses GAAP as the foundation for its comprehensive set of approved accounting methods and practices.
Gross domestic product (GDP)
Gross domestic product (GDP) is the total monetary or market value of all the finished goods and services produced within a country’s borders in a specific time period. As a broad measure of overall domestic production, it functions as a comprehensive scorecard of a given country’s economic health. Though GDP is typically calculated on an annual basis, it is sometimes calculated on a quarterly basis as well. In the U.S., for example, the government releases an annualized GDP estimate for each fiscal quarter and also for the calendar year. The individual data sets included in this report are given in real terms, so the data is adjusted for price changes and is, therefore, net of inflation.
Net Asset Value (NAV)
Net asset value (NAV) is the value of an investment fund that is determined by subtracting its liabilities from its assets. The fund's per-share NAV is then obtained by dividing NAV by the number of shares outstanding. Most commonly used with a mutual fund or unit investment trusts, per-share NAV is the price at which the shares of the funds registered with the U.S. Securities and Exchange Commission (SEC) trade. NAV can change on a daily basis. Therefore, per-share NAV can, as well.
Real Estate Investment Trusts (REIT)
REITs, or real estate investment trusts, are companies that own or finance income-producing real estate across a range of property sectors. These real estate companies have to meet a number of requirements to qualify as REITs. Most REITs trade on major stock exchanges, and they offer a number of benefits to investors.
Sarbanes-Oxley (SOX)
The Sarbanes-Oxley Act of 2002 is a law the U.S. Congress passed on July 30 of that year to help protect investors from fraudulent financial reporting by corporations. Also known as the SOX Act of 2002, it mandated strict reforms to existing securities regulations and imposed tough new penalties on lawbreakers. The Sarbanes-Oxley Act of 2002 came in response to financial scandals in the early 2000s involving publicly traded companies such as Enron Corporation, Tyco International plc, and WorldCom. The high-profile frauds shook investor confidence in the trustworthiness of corporate financial statements and led many to demand an overhaul of decades-old regulatory standards.
Warren Buffett's - Income Statement Rules of Thumb
| Metric | Equation | Threshold |
|---|---|---|
| Gross Margin | Gross Profit ÷ Revenue | > 40% |
| SG&A Margin | SG&A ÷ Gross Profit | < 30% |
| R&D Margin | R&D ÷ Gross Profit | < 30% |
| Depreciation Margin | Depreciation ÷ Gross Profit | < 10% |
| Interest Margin | Interest Expense ÷ Operating Income | < 15% |
| Tax Margin | Taxes ÷ Pre-Tax Income | Corp Tax Rate |
| Net Income Margin | Net Income ÷ Revenue | > 20% |
| EPS Growth | Year 2 EPS ÷ Year 1 EPS | Positive & Growing |
Warren Buffett's - Balance Sheet Rules of Thumb
| Metric | Equation | Threshold |
|---|---|---|
| Cash & Debt | Cash > Debt | Cash > Debt |
| Adjusted Debt to Equity | Total Liabilities ÷ (Shareholder Equity * Treasury Stock) | Below 0.80 |
| Preferred Stock | None | None |
| Retained Earnings | Year 2 Retained Earning ÷ Year 1 Retained Earning | Consistent Growth |
| Treasury Stock | Treasury Stock > 1 | Exists |
Warren Buffett's - Cash Flow Statement Rules of Thumb
| Metric | Equation | Threshold |
|---|---|---|
| Capex Margin | Capex ÷ Net Income | < 25% |
Peter Lynch's 25 Golden Rules for Investing
Rule 1: Investing is fun and exciting, but dangerous if you don't do any work.
Rule 2: Your investor's edge is not something you get from Wall Street experts. It's something
you already have. You can outperform the experts if you use your edge by investing in
companies or industries you already understand.
Rule 3: Over the past 3 decades, the stock market has come to be dominated by a herd of professional
investors. Contrary to popular belief, this makes it easier for the amateur investor. You can beat
the market by ignoring the herd.
Rule 4: Behind every stock is a company. Find out what it's doing.
Rule 5: Often, there is no correlation between the success of a company's operations
and the success of its stock over a few months or even a few years. In the long term, there
is a 100% correlation between the success of the company and the success of its stock. This
disparity is the key to making money; it pays to be patient, and to own successful
companies.
Rule 6: You have to know what you own, and why you own it. "This baby is a cinch to go up" doesn't count.
Rule 7: Long shots almost always miss the mark.
Rule 8: Owning stocks is like having children — don't get involved with more than
you can handle. The part-time stockpicker probably has time to follow 8-12 companies,
and to buy and sell shares as conditions warrant. There don't have to be more than 5
companies in the portfolio at any one time.
Rule 9: If you can't find any companies that you think are attractive, put your
money in the bank until you discover some.
Rule 10: Never invest in a company without understanding its finances. The
biggest losses in stocks come from companies with poor balance sheets. Always look
at the balance sheet to see if a company is solvent before you risk your money
on it.
Rule 11: Avoid hot stocks in hot industries. Great companies in cold, nongrowth
industries are consistent big winners.
Rule 12: With small companies, you are better off to wait until they
turn a profit before you invest.
Rule 13: If you are thinking of investing in a troubled industry, buy
the companies with staying power. Also, wait for the industry to show signs
of revival. Buggy whips and radio tubes were troubled industries that never
came back.
Rule 14: If you invest $1000 in a stock, all you can lose is $1000, but
you stand to gain $10,000 or even $50,000 over time if you are patient. The
average person can concentrate on a few good companies, while the fund manager
is forced to diversify. By owning too many stocks, you lose this advantage of
concentration. It only takes a handful of big winners to make a lifetime of
investing worthwhile.
Rule 15: In every industry and every region of the country, the observant
amateur can find great growth companies long before the professionals have
discovered them.
Rule 16: A stock market decline is as routine as a January blizzard in
Colorado. If you are prepared, it can't hurt you. A decline is a great opportunity
to pick up the bargains left behind by investors who are fleeing the storm in
panic.
Rule 17: Everyone has the brainpower to make money in stocks. Not everyone
has the stomach. If you are susceptible to selling everything in a panic, you ought
to avoid stocks and stock mutual funds altogether.
Rule 18: There is always something to worry about. Avoid weekend thinking
and ignore the latest dire predictions of the newscasters. Sell a stock because
the company's fundamentals deteriorate, not because the sky is falling.
Rule 19: Nobody can predict interest rates, the future direction of the
economy, or the stock market, Dismiss all such forecasts and concentrate on what's
actually happening to the companies in which you have invested.
Rule 20: If you study 10 companies, you will find 1 for which the story
is better than expected. If you study 50, you'll find 5. There are always pleasant
surprises to be found in the stock market — companies whose achievements are being
overlooked on Wall Street.
Rule 21: If you don't study any companies, you have the same success buying
stocks as you do in a poker game if you bet without looking at your cards.
Rule 22: Time is on your side when you own shares of superior companies.
You can afford to be patient — even if you missed Wal-Mart in the first five years,
it was a great stock to own in the next five years. Time is against you when you
own options.
Rule 23: If you have the stomach for stocks, but neither the time nor the
inclination to do the homework, invest in equity mutual funds. Here, it's a good
idea to diversify. You should own a few different kinds of funds, with managers
who pursue different styles of investing: growth, value small companies, large
companies etc. Investing the six of the same kind of fund is not
diversification.
Rule 24: Among the major stock markets of the world, the U.S. market
ranks 8th in total return over the past decade. You can take advantage of the
fastergrowing economies by investing some portion of your assets in an overseas
fund with a good record.
Rule 25: In the long run, a portfolio of well-chosen stocks and/or
equity mutual funds will always outperform a portfolio of bonds or a
money-market account. In the long run, a portfolio of poorly chosen
stocks won't outperform the money left under the mattress.
The Value of Learning from Financial Failures
When examining financial successes and mishaps, it becomes apparent that
understanding failures can be as crucial, if not more so, than analyzing wins.
Financial failures offer a unique perspective that provides valuable insights
into the pitfalls of financial management and investment decision-making.
These lessons are indispensable for individuals, entrepreneurs, and financial
experts alike, as they paint a realistic picture of the complexities involved
in financial planning and market participation.
Key Lessons from Financial Failures
1. Risk Management:
- Failures often highlight the importance of risk assessment and management.
- Overleveraging and inadequate diversification are common issues.
- These teach the critical need for balance and caution in financial endeavors.
- Financial debacles frequently stem from decisions influenced by emotions rather than data.
- Panic selling and euphoric buying are classic examples.
- They underscore the necessity for maintaining a rational approach.
- Failures reveal the volatile nature of markets.
- Changes in market conditions can swiftly turn profitable ventures into losses.
- Recognizing market volatility aids in setting realistic expectations and effective strategies.
- Inadequate research and failure to perform due diligence are often exposed in financial collapses.
- A thorough understanding of the market, business models, and financial products is essential.
- This emphasizes the importance of comprehensive analysis and preparation.
- Financial failures often stem from resistance to change or inability to adapt to new circumstances.
- Being adaptable and agile can mitigate the impact of unforeseen changes.
Du Pont Model
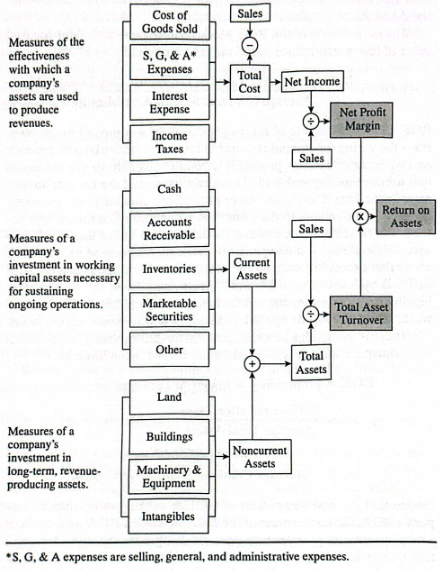
ROE Model
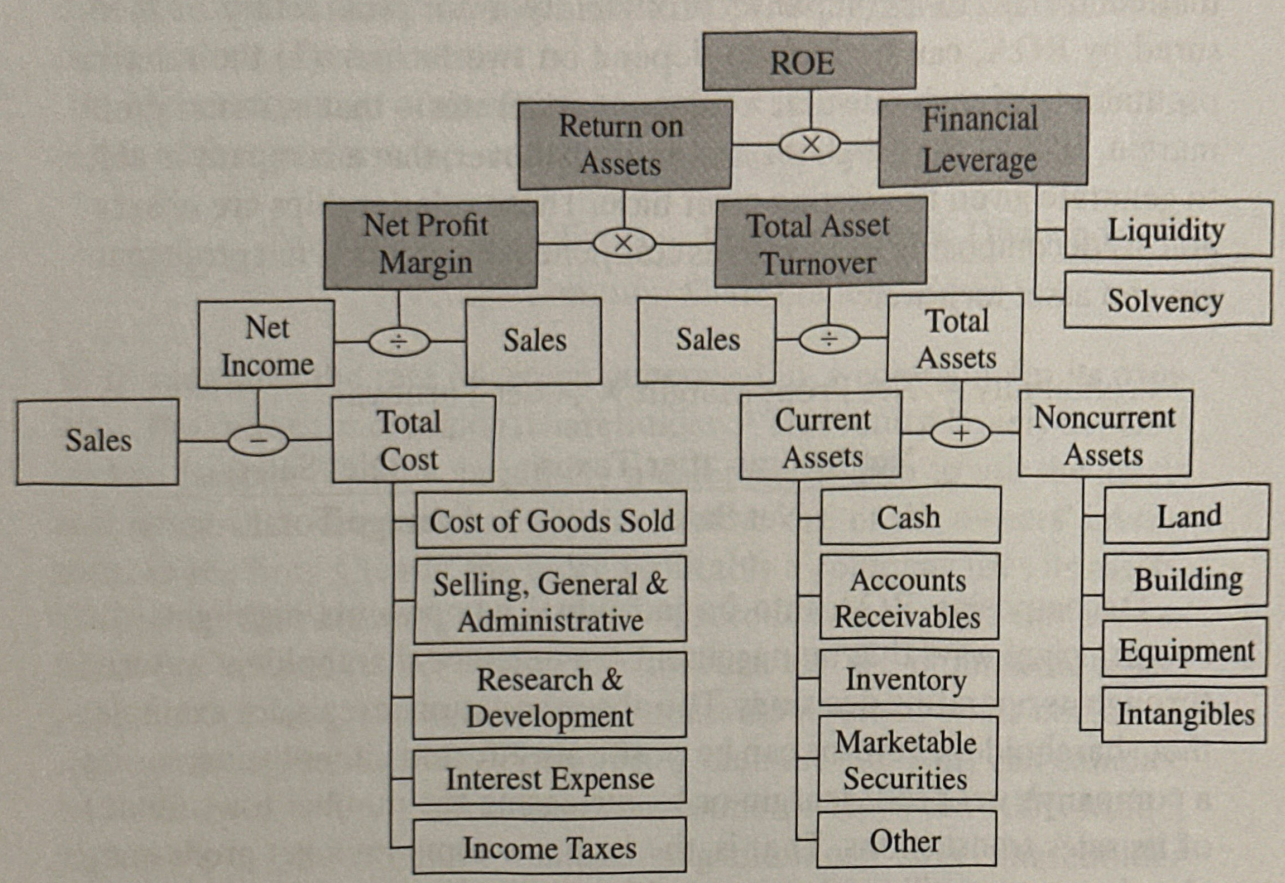
ROE Simplified

Cash Conversion Ratio
EBITDA
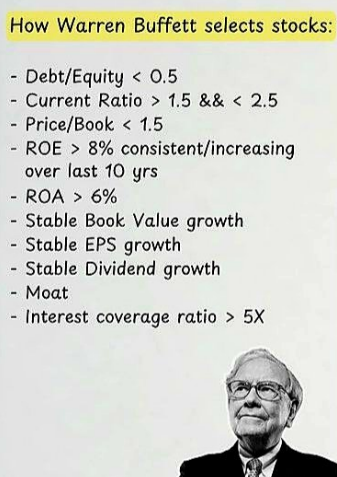
Buffett Strategy
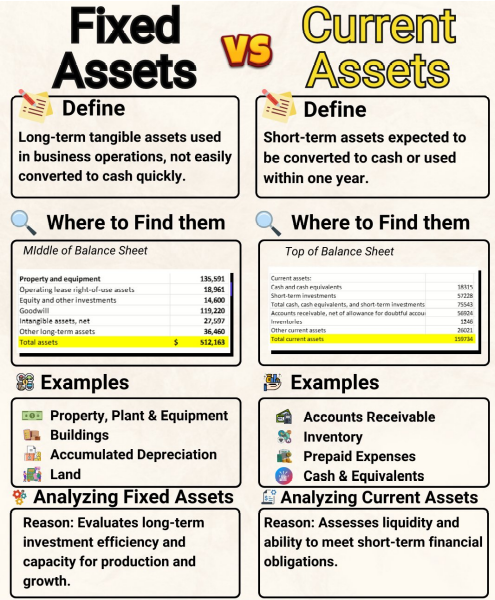
Fixed vs. Current Assets
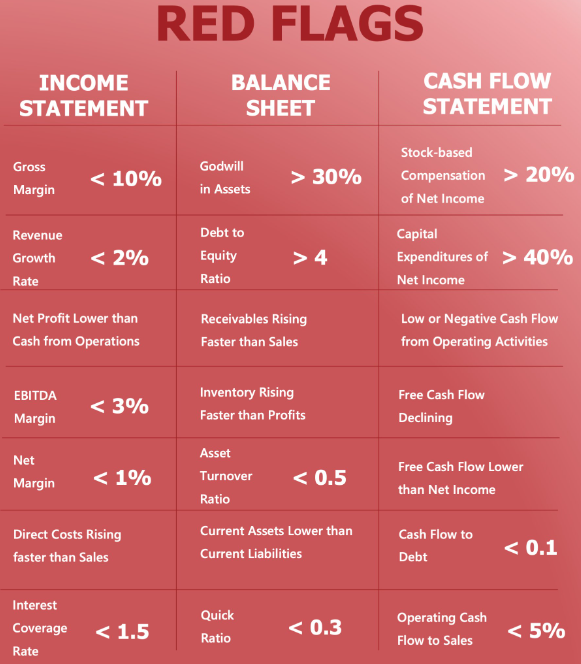
Financial Statements Red Flags :
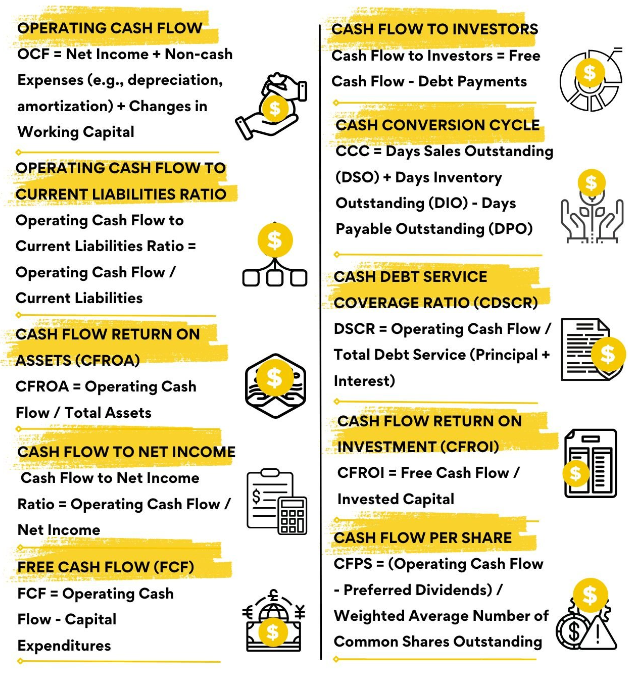
10 Finance Key Performance Indicators (KPI's) :
Return of Equity (ROE) :
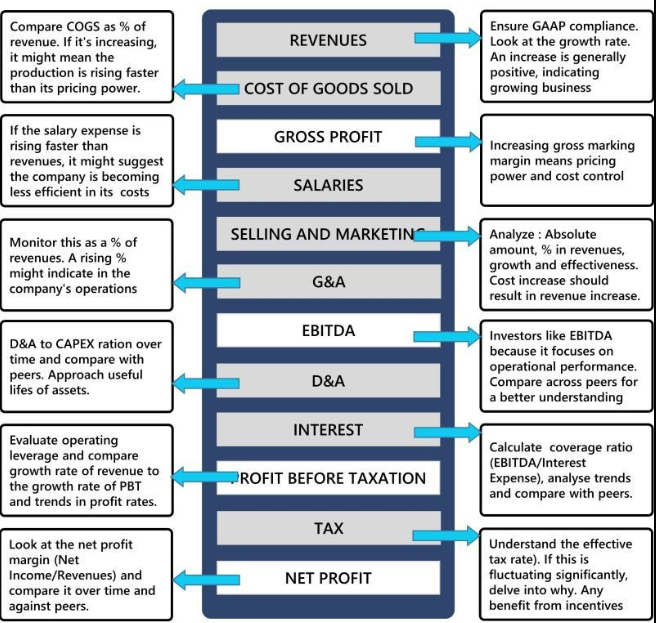
Evaluating Income Statement :
Cash Flow Driver : Revenue Growth

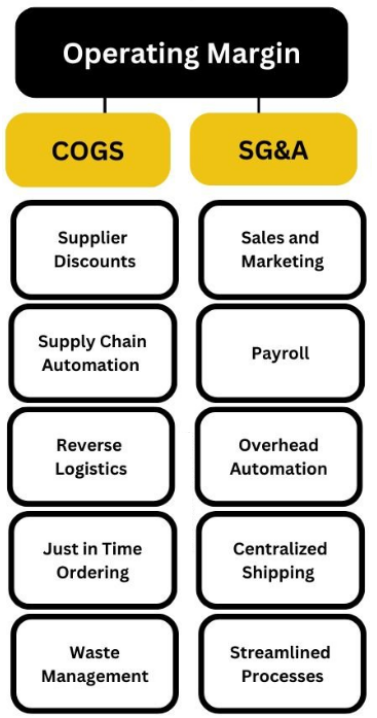
Cash Flow Driver : Operating Margin
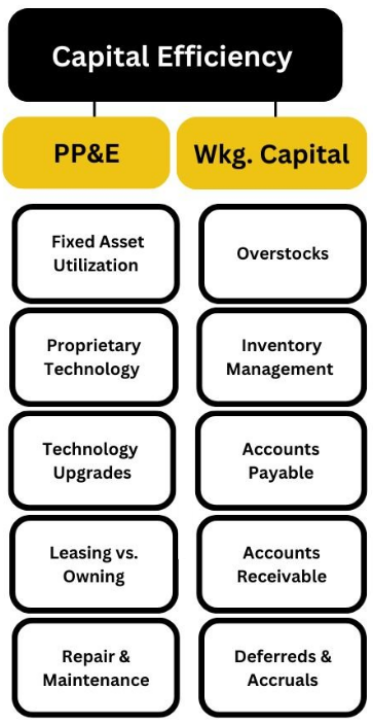
Cash Flow Driver : Capital Efficiency
Key Profitability Ratios: ROE vs ROA vs ROIC vs ROCE
Key Accounting Ratios
Key Accounting Ratios
What is the Piotroski Score?
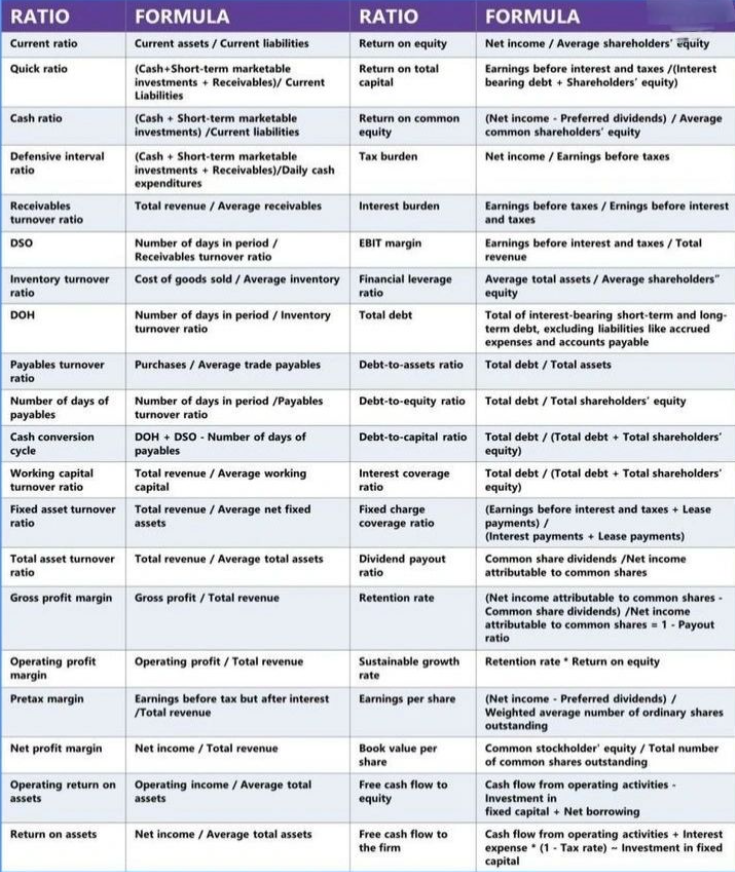
Key Financial Ratio Table
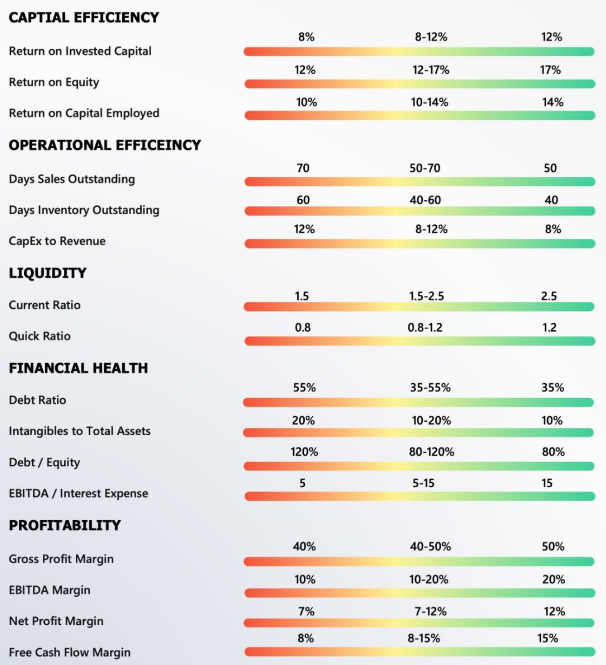
Key Ratio Benchmarking
Understanding PE Ratio
Ray Dalio Principles

Understanding Profit
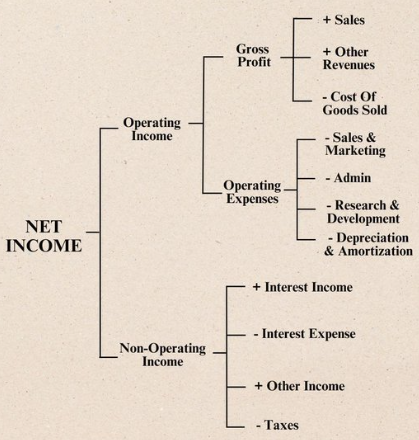
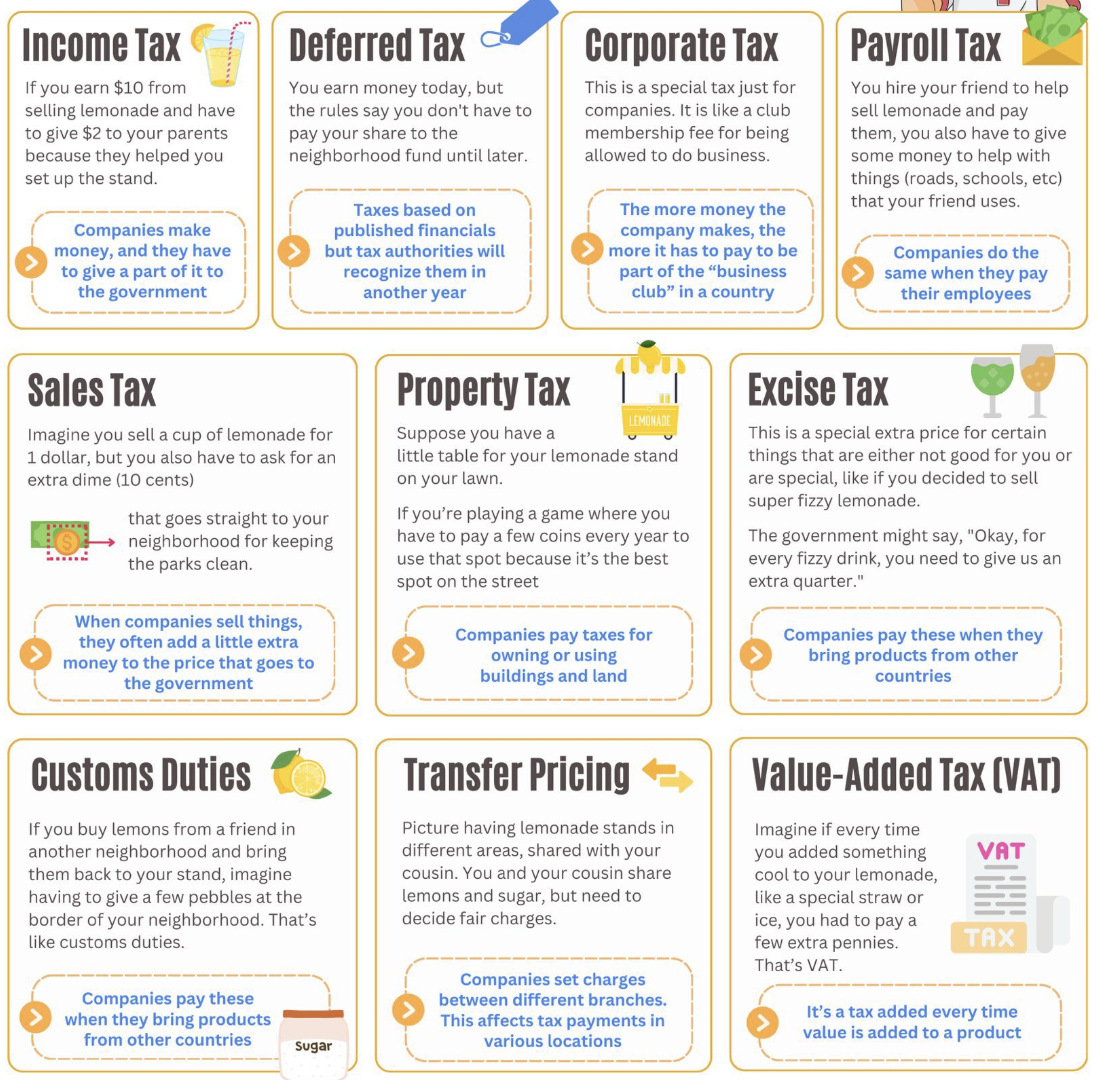
Types of Tax Explained
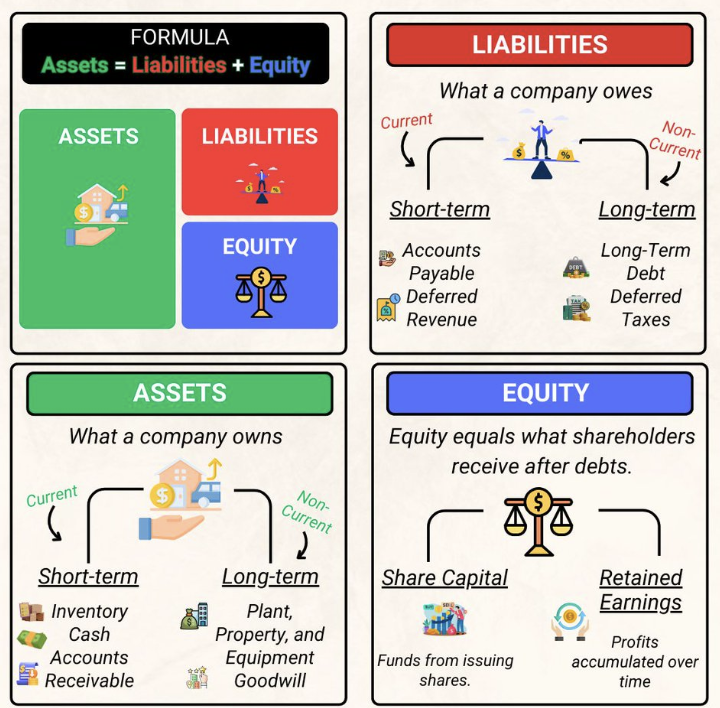
Balance Sheet Explained
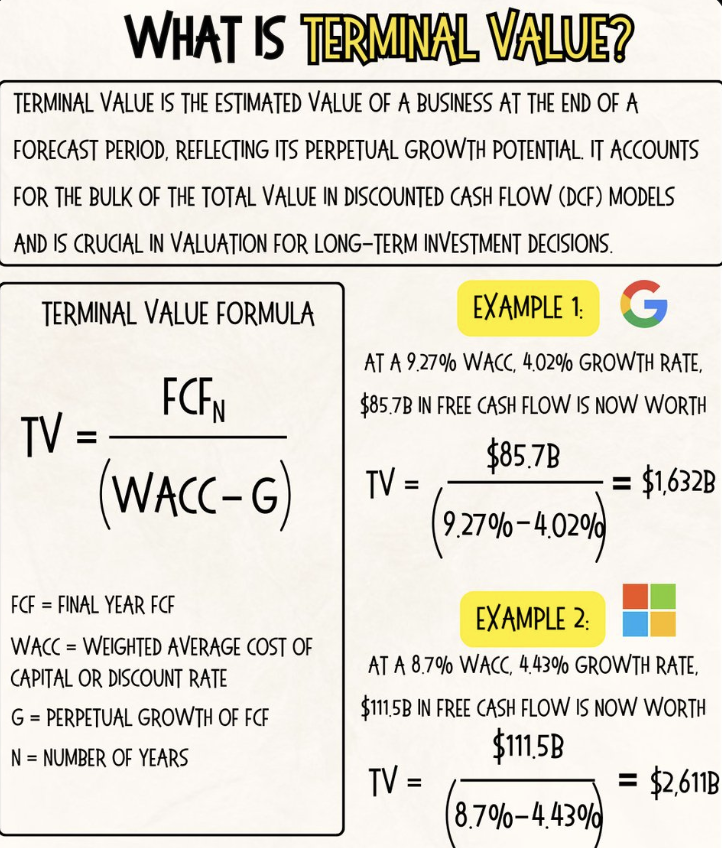
Terminal Value Explained
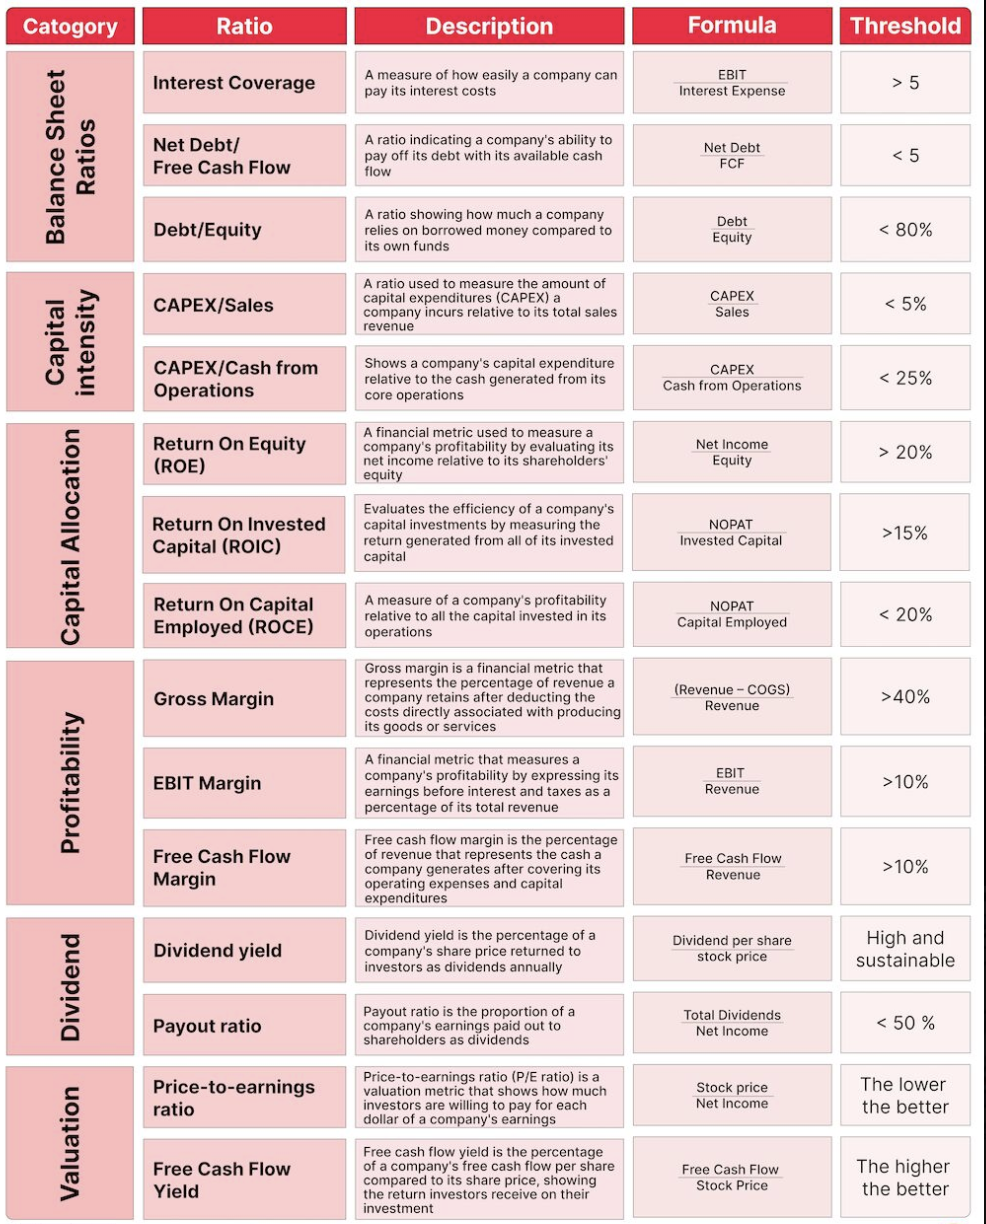
Key Financial Ratios
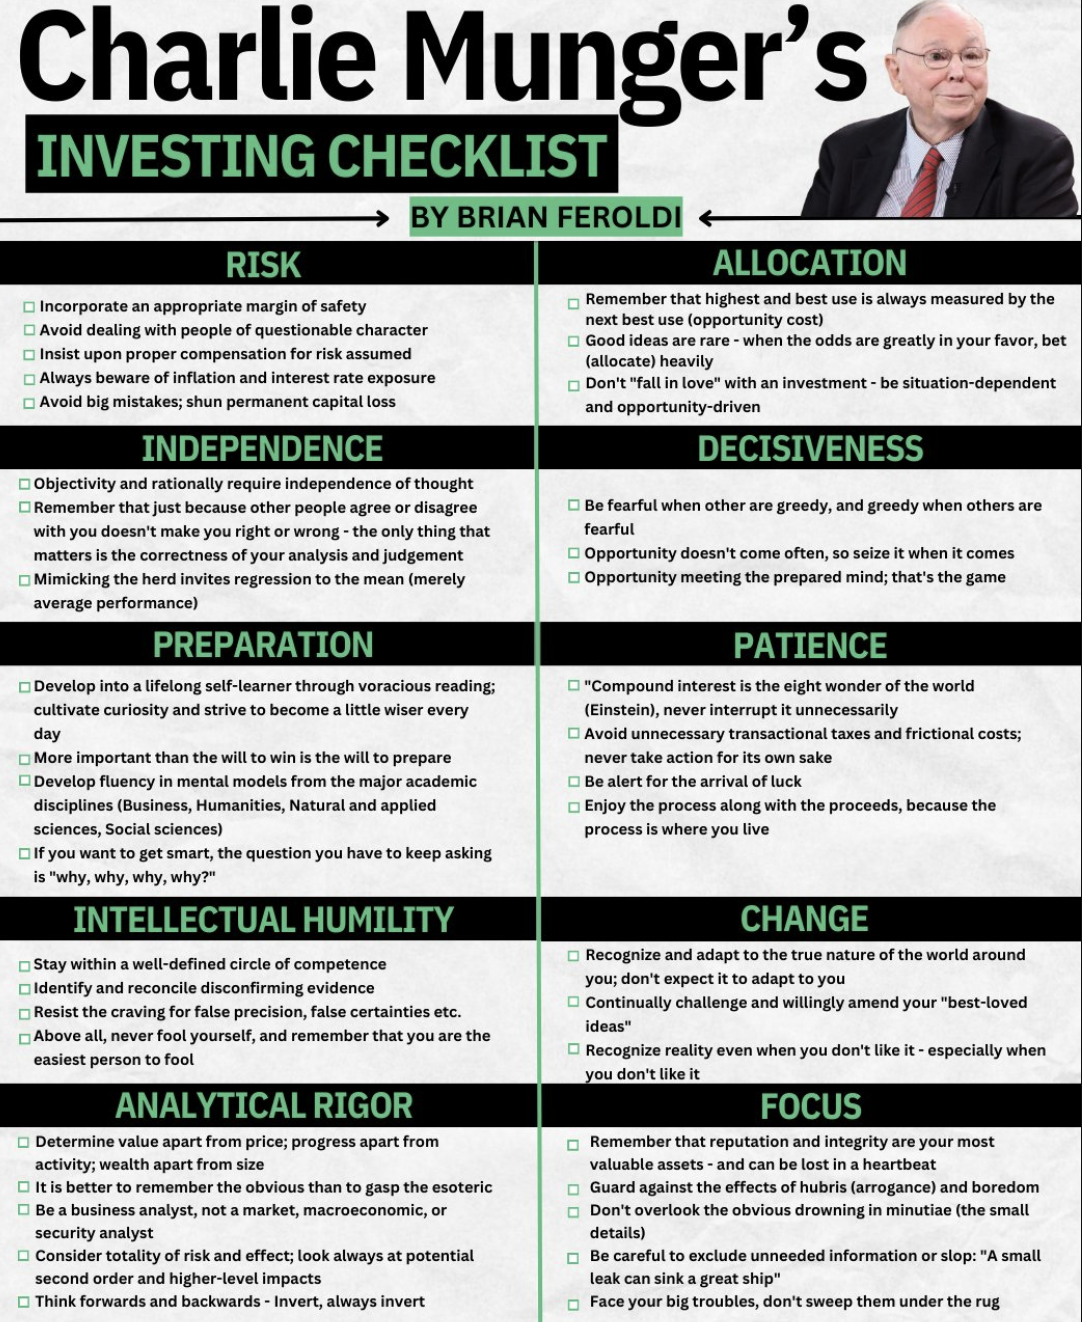
Charlie Munger
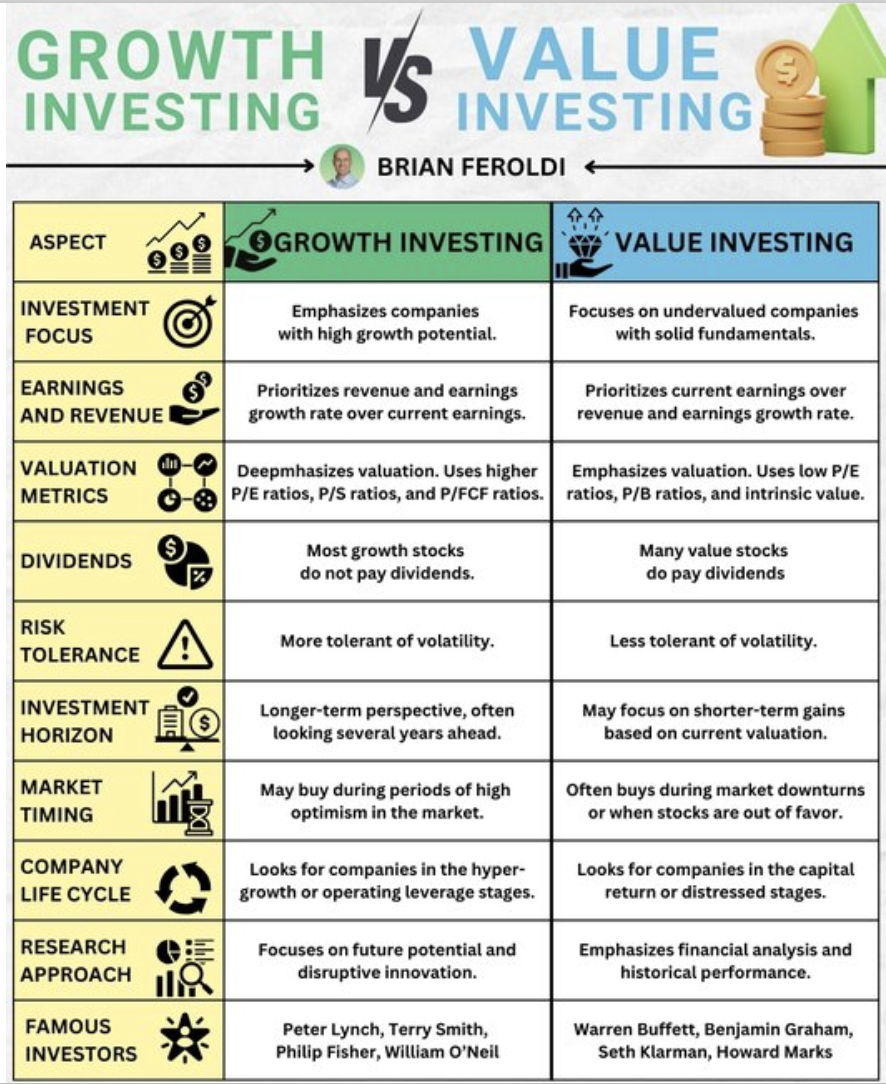
Growth vs Value Investing
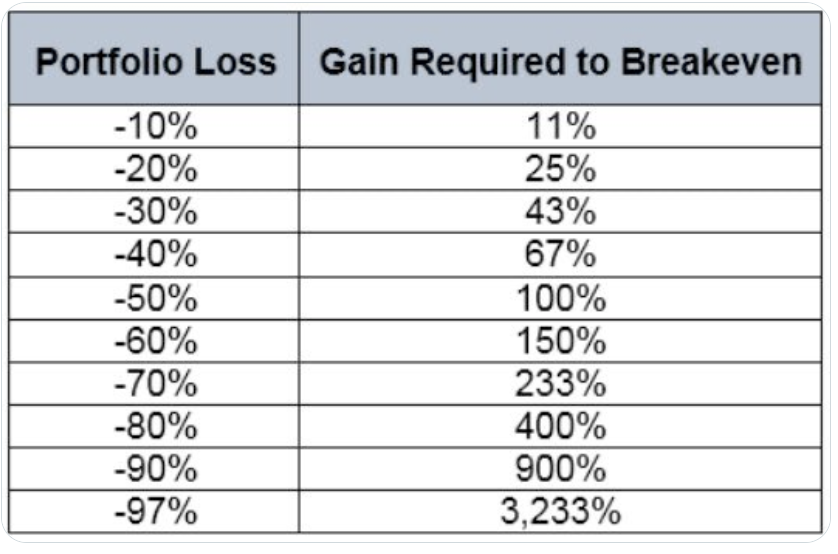
Loss and Gain Analysis
Python for everything
