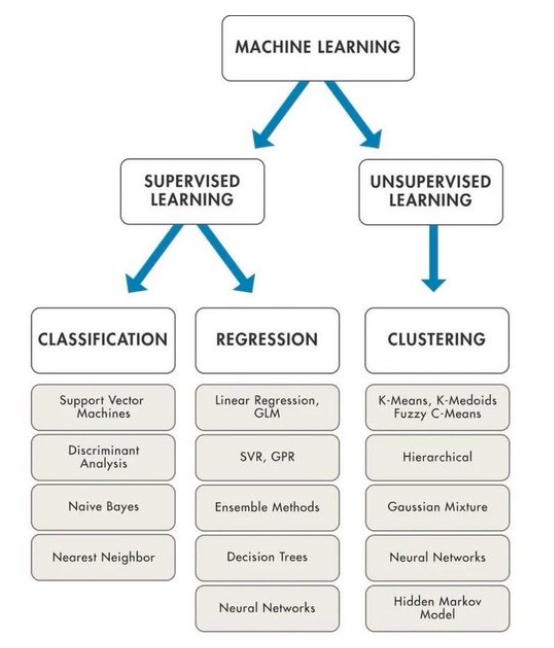
Download stock data using Yahoo Finance & Charting:
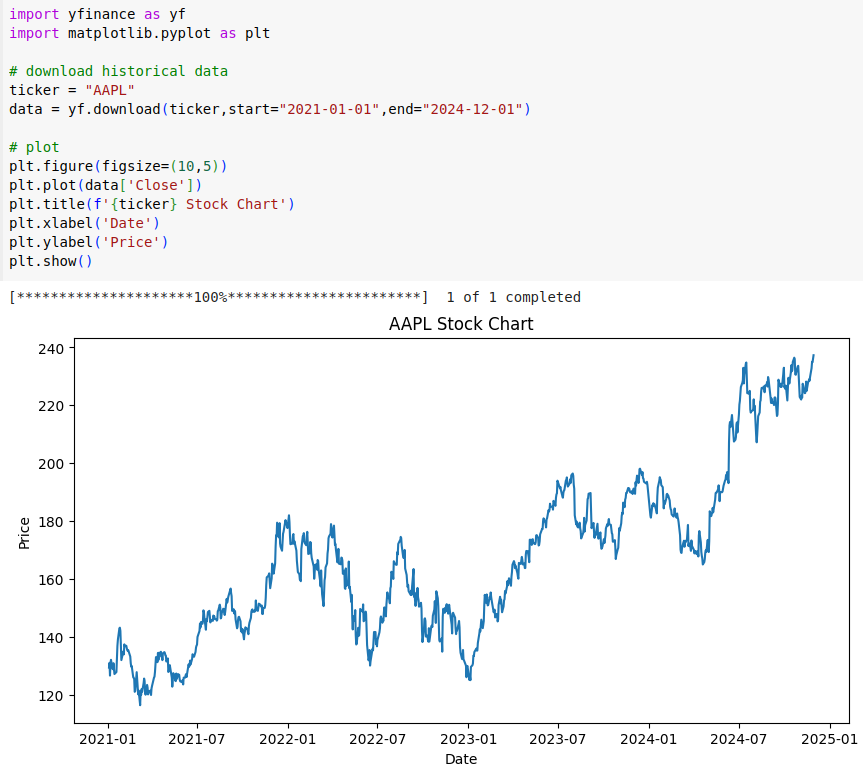
Data Visualization : Histogram Example
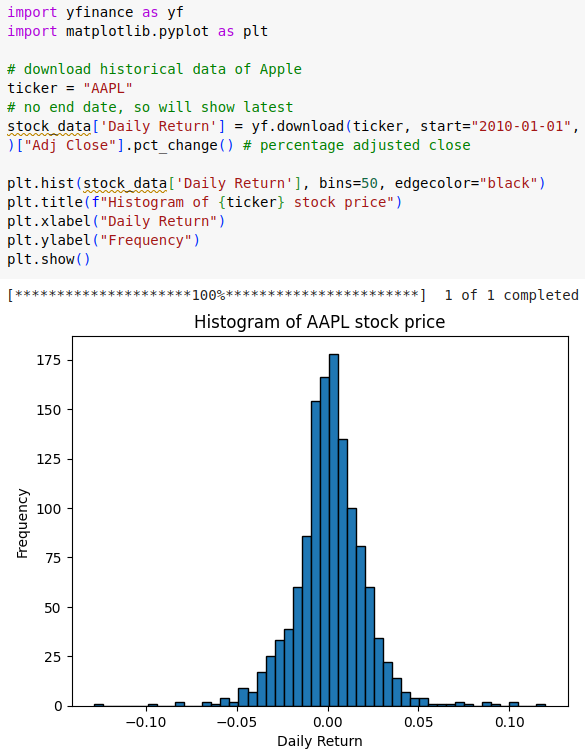
Magnificent Seven Stock Analysis:
Five year stock price analysis of top 7 companies in the world.
Magnificent 7 Get Key Stats using 3rd party API (FMD):
FMD provides one of the most accurate financial data available on the market.
You can get
historical prices, fundamental data, insider transactions, and much more that goes back
30 years in history.
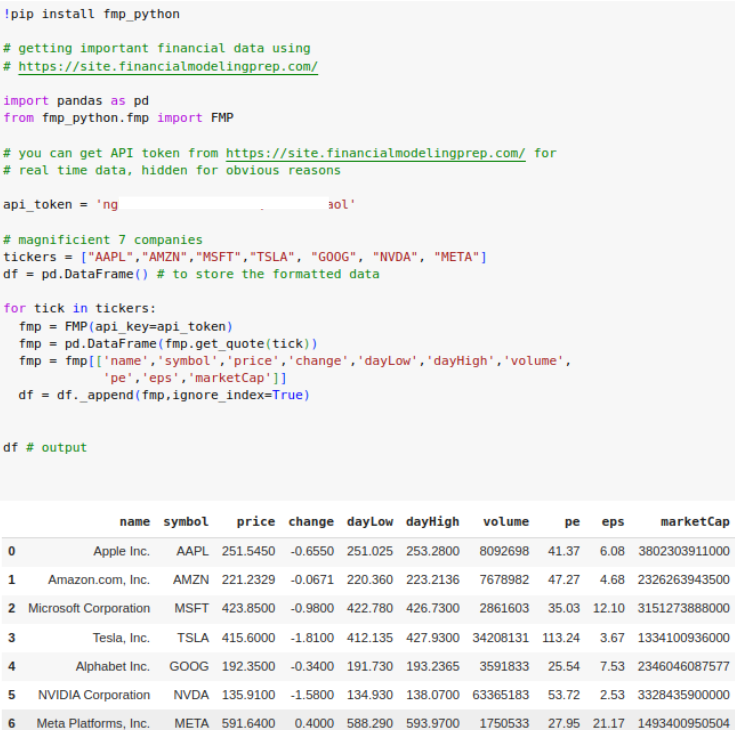
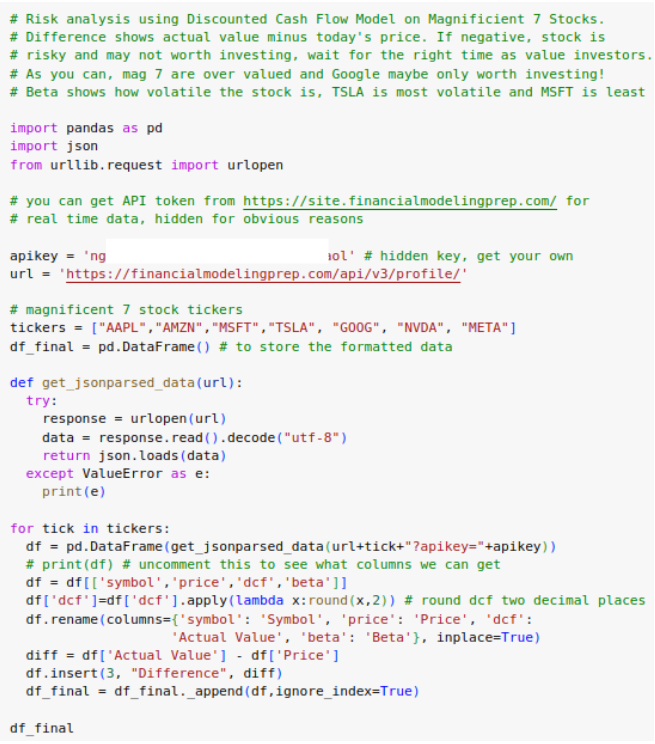
Magnificent 7 DCF Analysis using 3rd party API (FMD):
DCF Analysis on Magnificent 7 stocks using FMD API

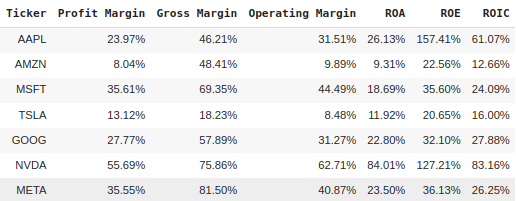
Magnificent 7 Margin Analysis using 3rd party API (FMD):
Margin, ROIC Analysis on Magnificent 7 stocks using FMD API
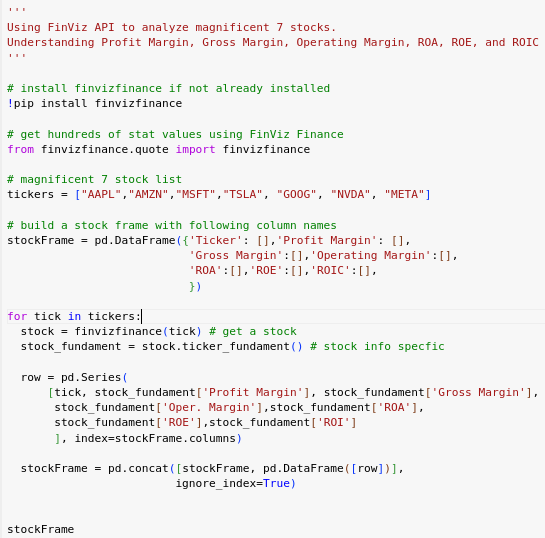
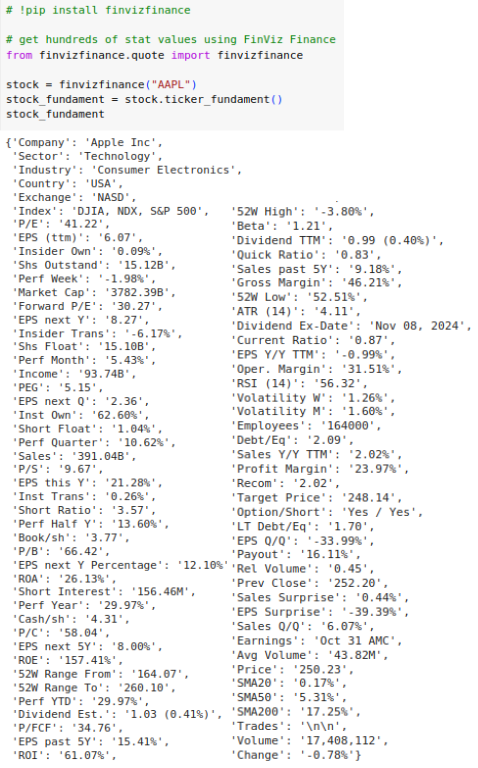
Getting Stats using FinViz:
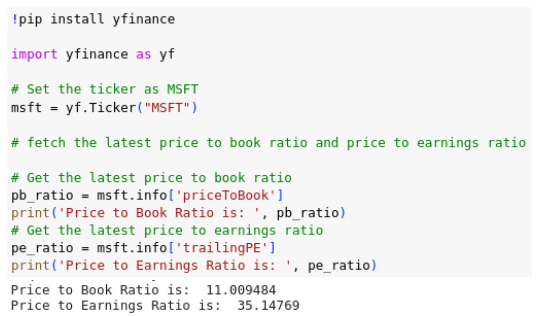
Getting Stats using Yahoo Finance:
Using FinViz API
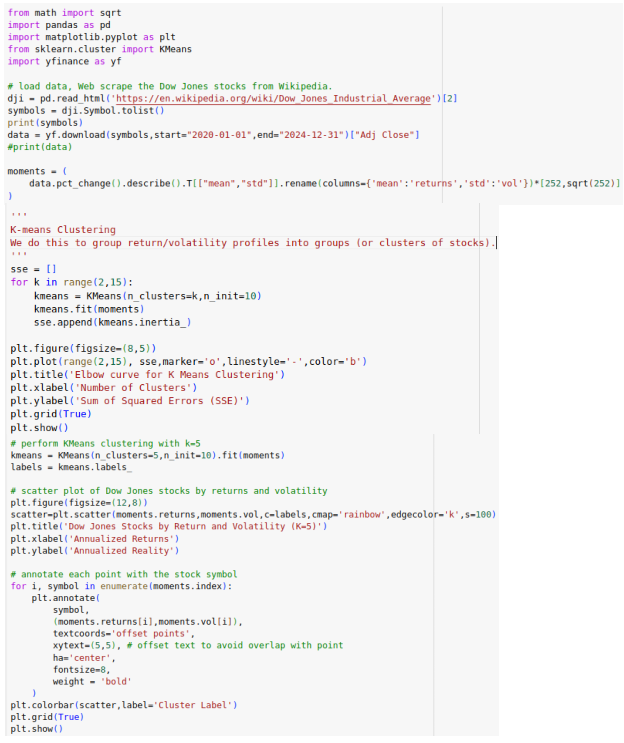
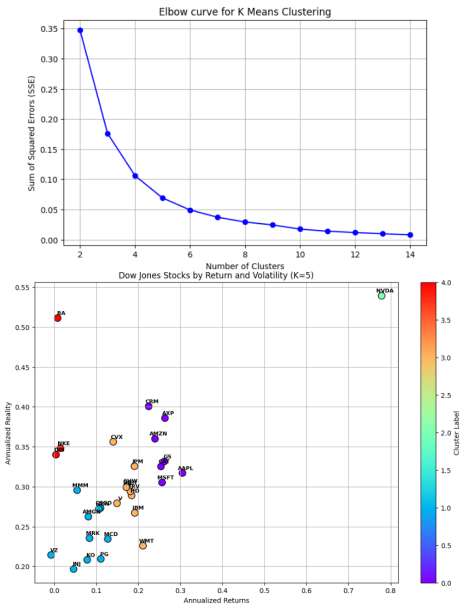
Dow 30 Stocks Analysis using K-Means Clustering:
K-Means Clustering is an Unsupervised Machine Learning algorithm, which groups the
unlabeled dataset into different clusters.
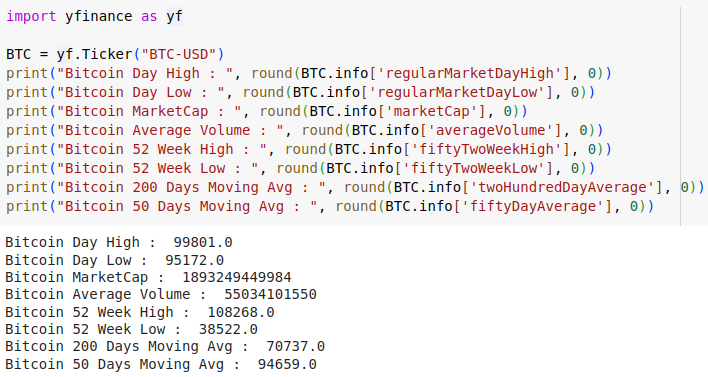
Bitcoin Stats Analysis using Yahoo Finance:
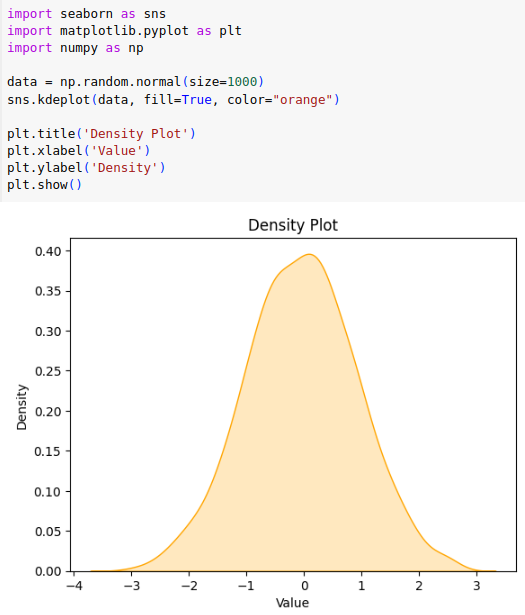
Data Visualization : Density plot using Python:
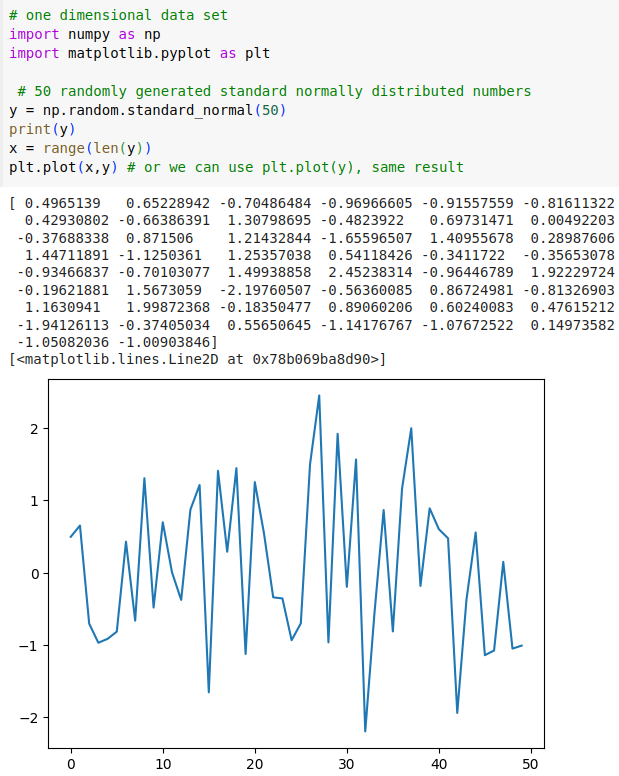
Data Visualization : One Dimensional Data Set
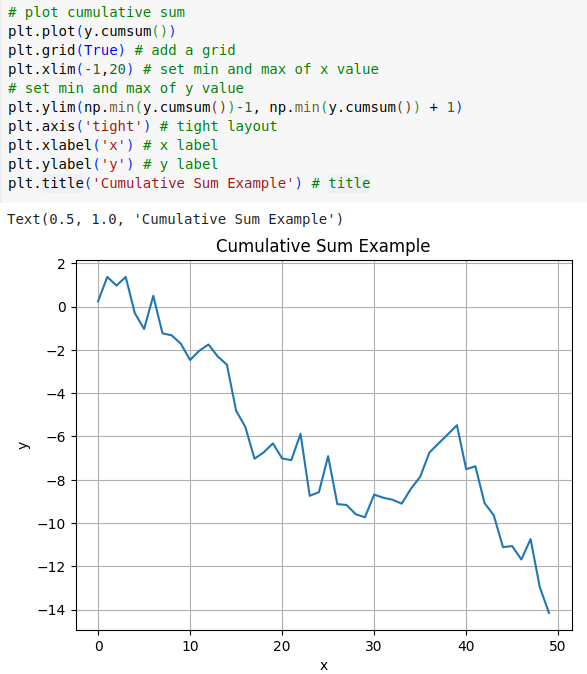

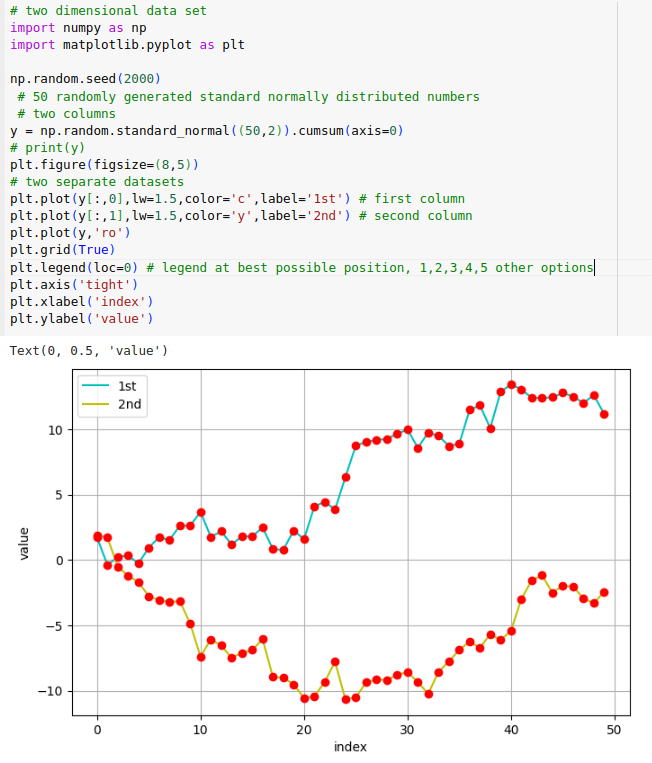
Data Visualization : Two Dimensional Data Set
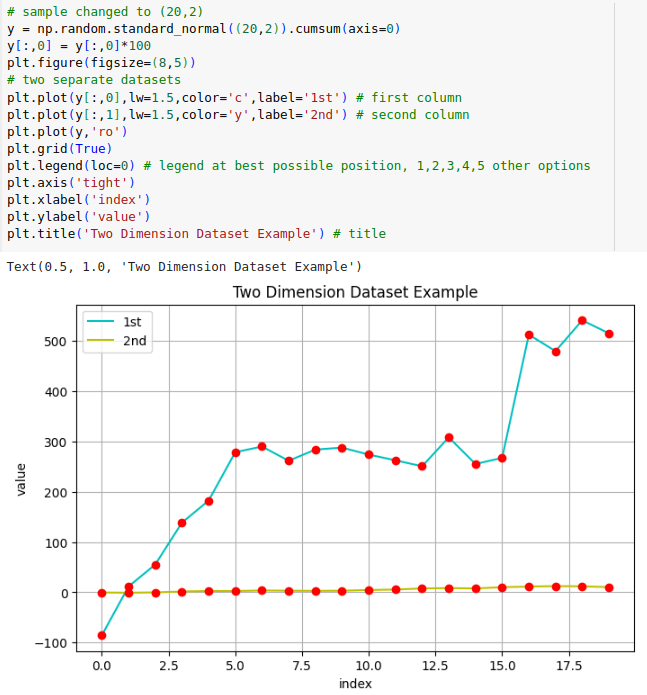
Data Visualization : Two Dimensional Data Set with Scaling Data
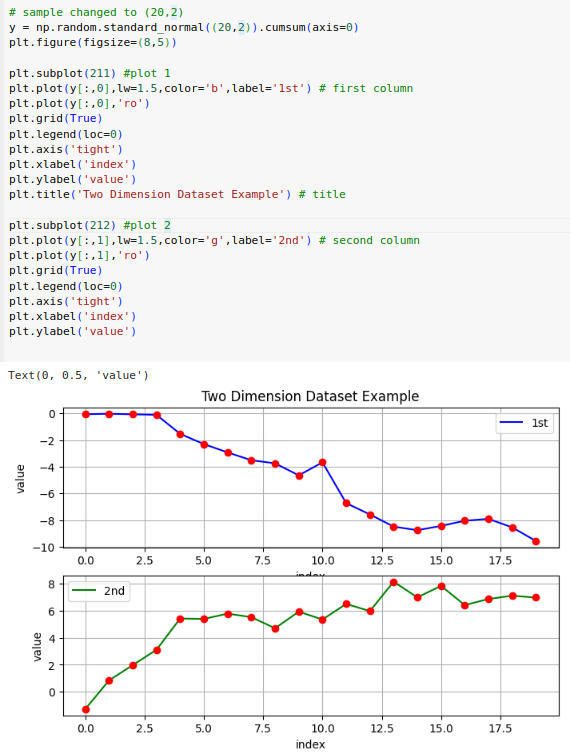
Data Visualization : Two Dimensional Data Set with two subplots
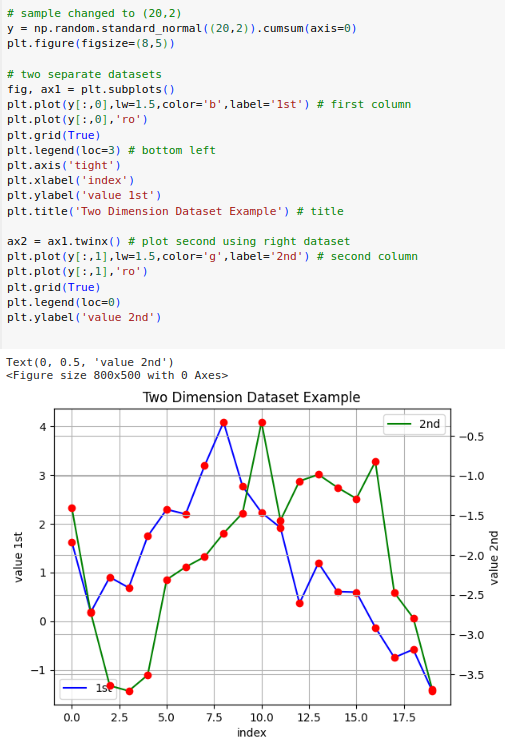
Data Visualization : Two Dimensional Data Set with two subplots
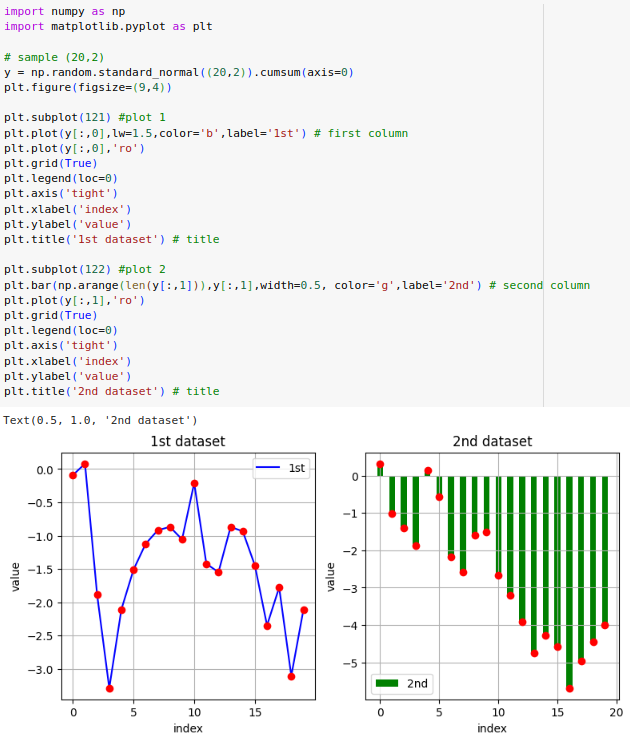
Data Visualization : Two Dimensional Data Set w/Line and Bar Charts
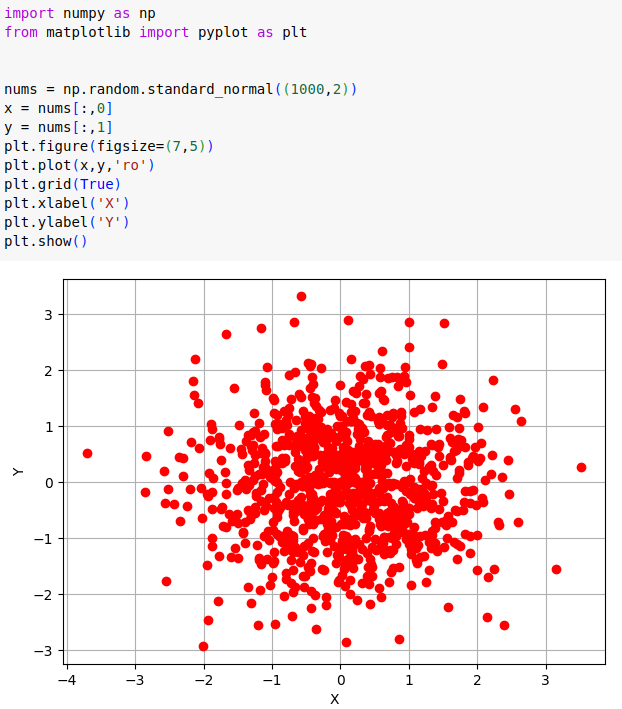
Data Visualization : Scatter Plot for 2D vector
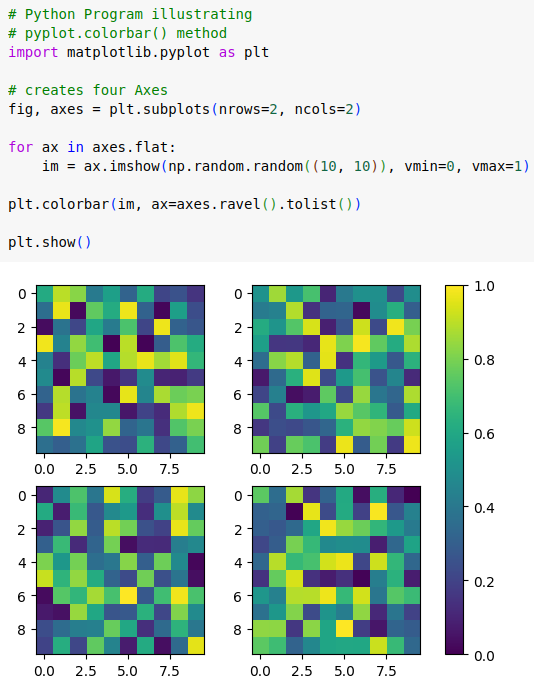
Data Visualization : Single colorbar to multiple subplots
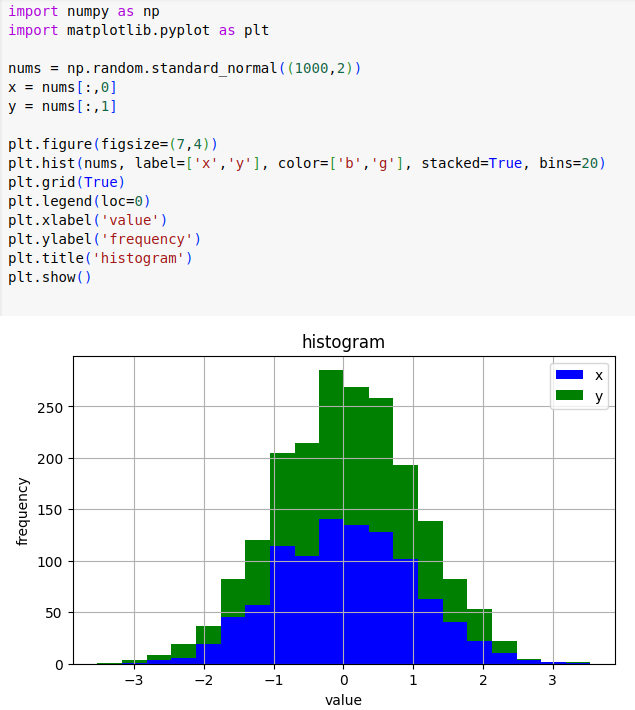
Data Visualization : Stacked histogram for two data sets
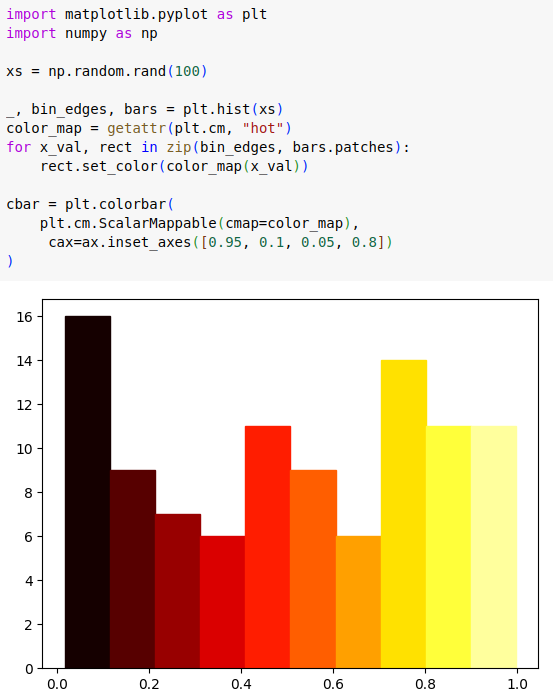
Data Visualization : Histogram Using Colorbar
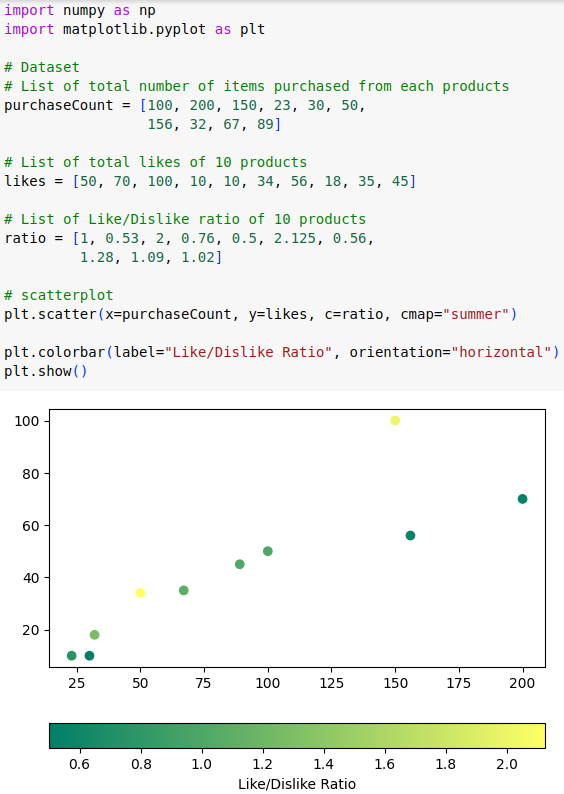
Data Visualization : Scatter Plot with 3D Plot
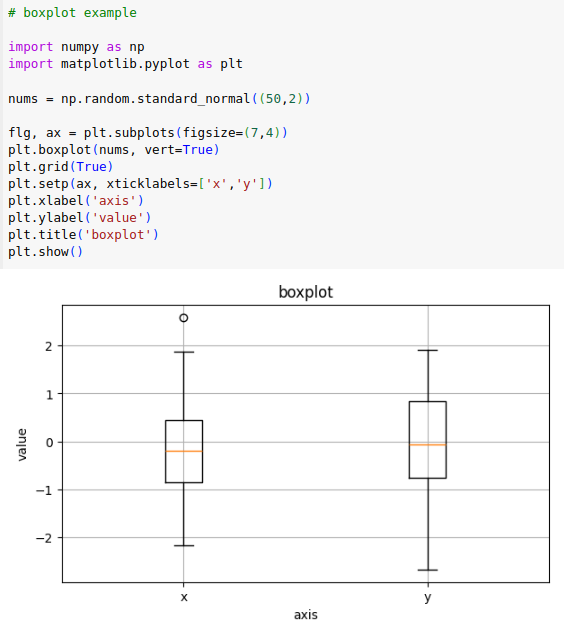
Data Visualization : Boxplot for two data sets
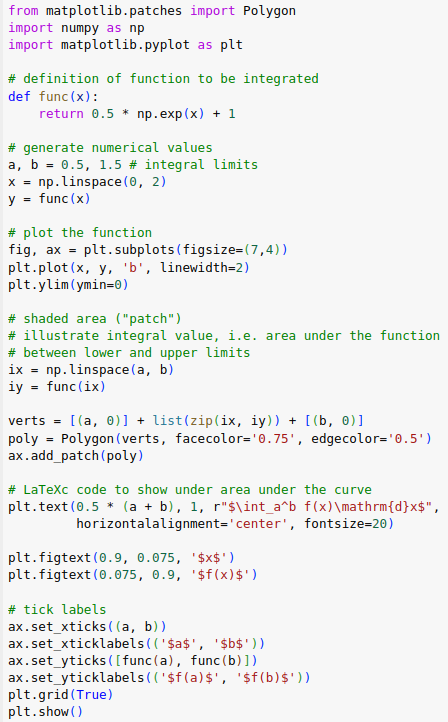
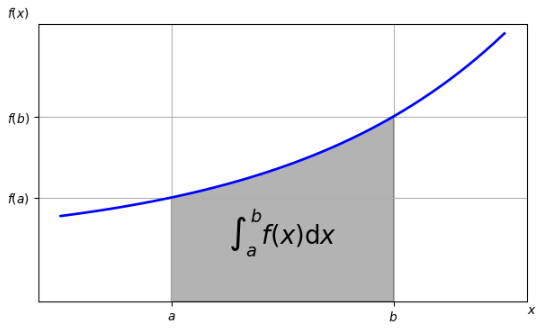
Data Visualization : Exponential function, integral area, and LaTeX labels
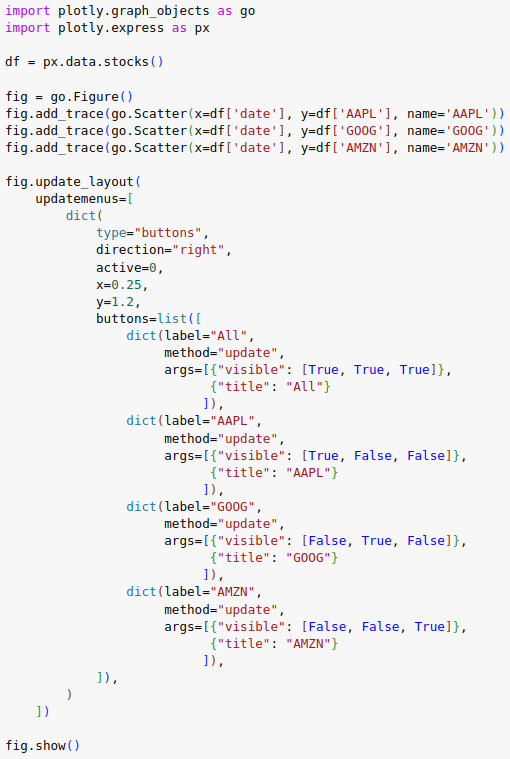
Data Visualization : Using Plotly to plot stock prices

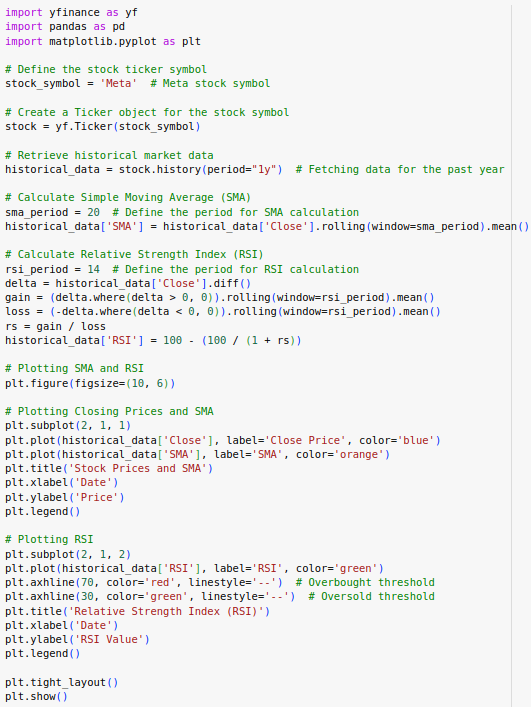
Data Visualization : Using Plotly to plot RSI

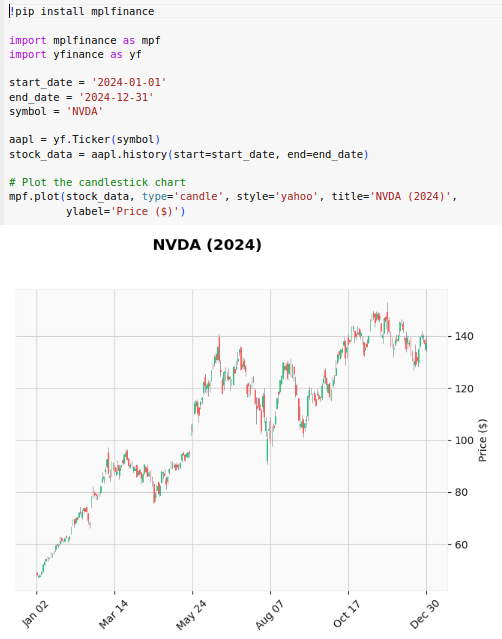
Data Visualization : Using MPLFinance Library Plot Candlestick Chart
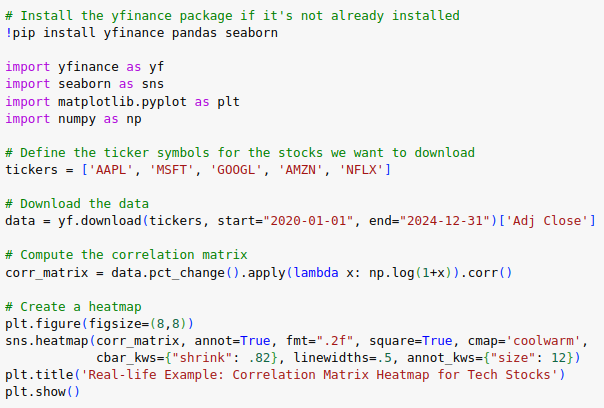
Data Visualization : Visualizing Stock Correlations with Heatmaps

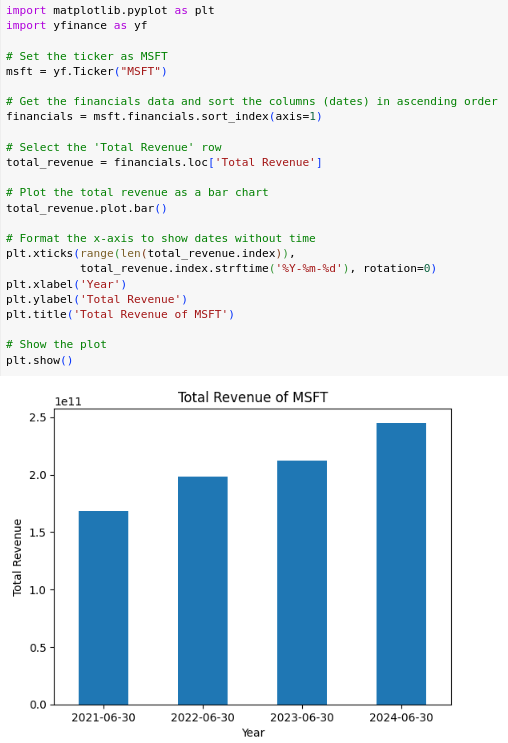
Data Visualization : Company Total Revenue using Yahoo Finance
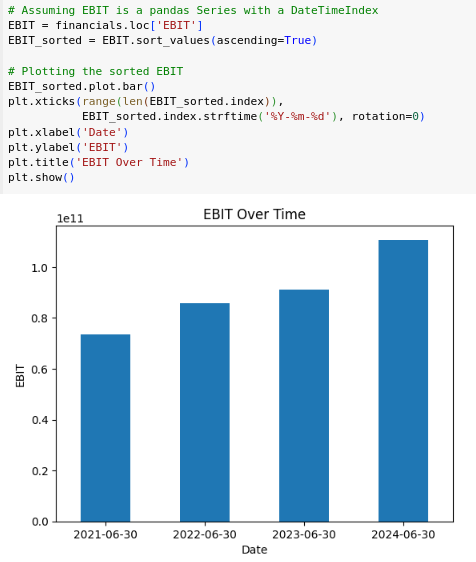
Data Visualization : Company EBIT using Yahoo Finance
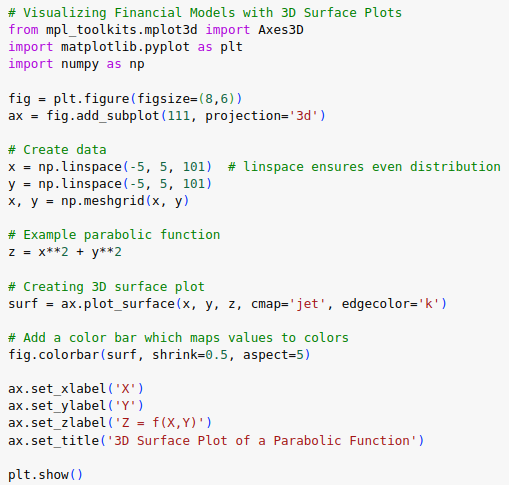
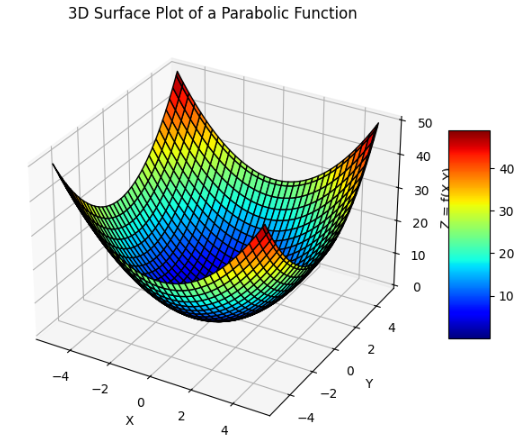
Data Visualization : Visualizing Financial Models with 3D Surface Plots
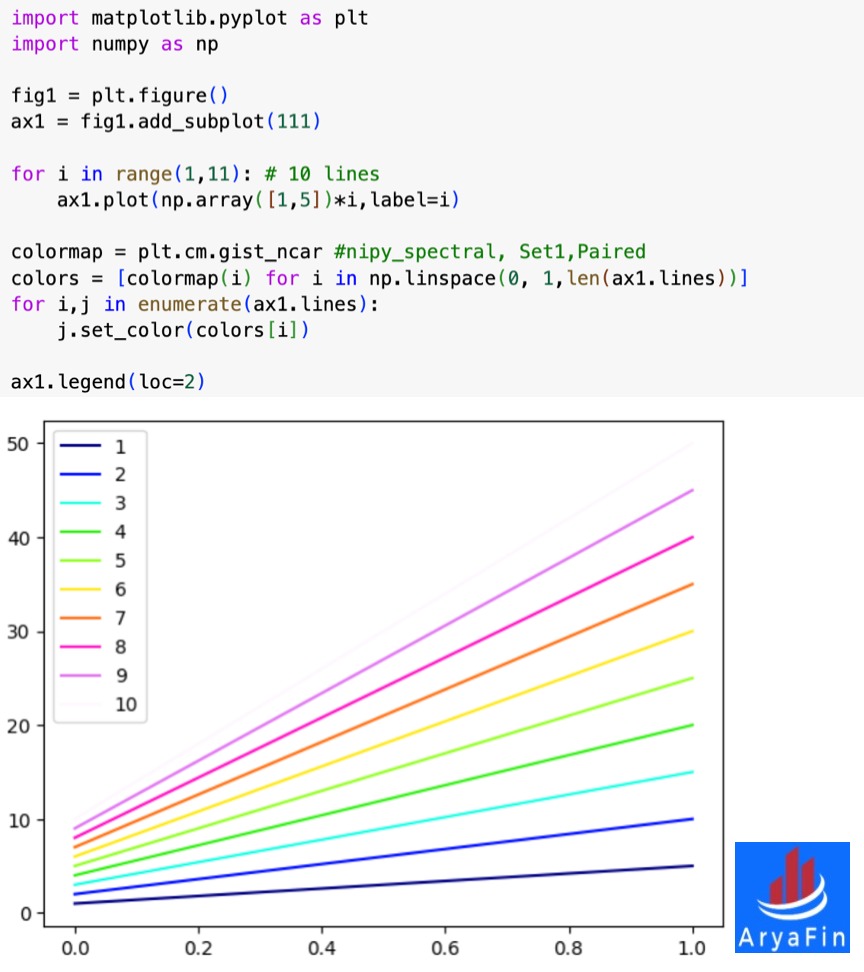
Data Visualization : Matplot Library
Using matplotlib to create the plots, visualize data to identify each plot with a different color which should be automatically generated by Python
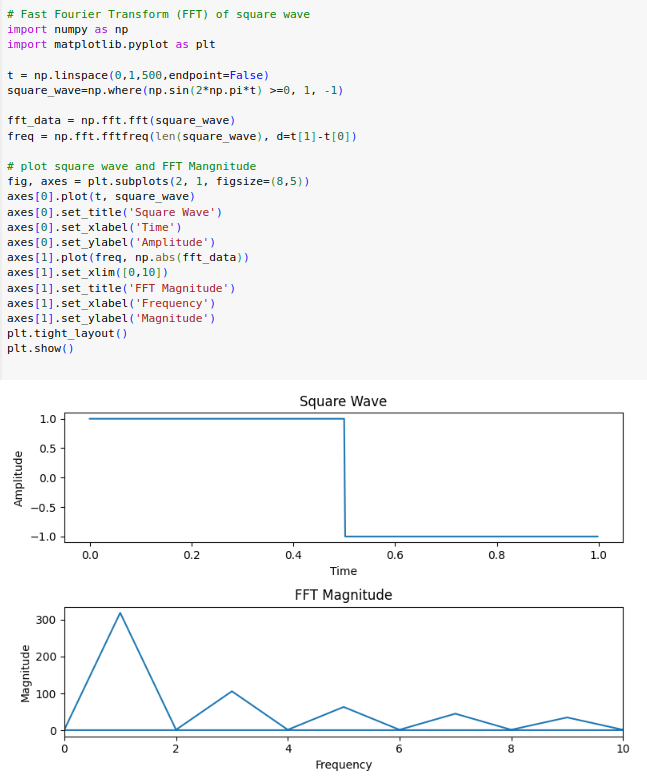
Data Visualization : Fast Fourier Transform (FFT) of square wave
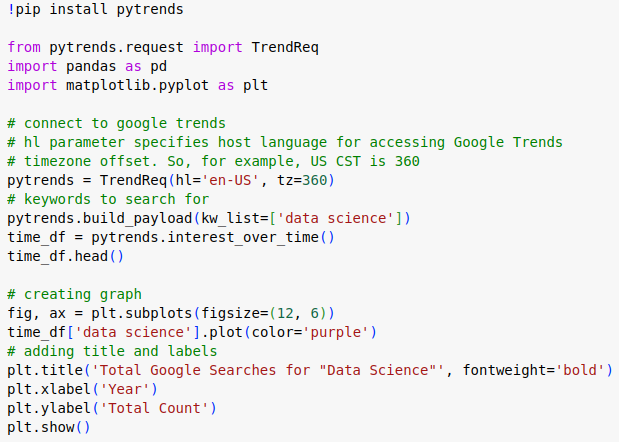
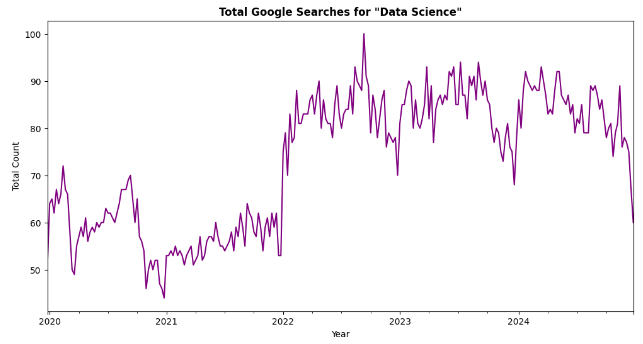
Data Visualization : Google Trends using Pytrends
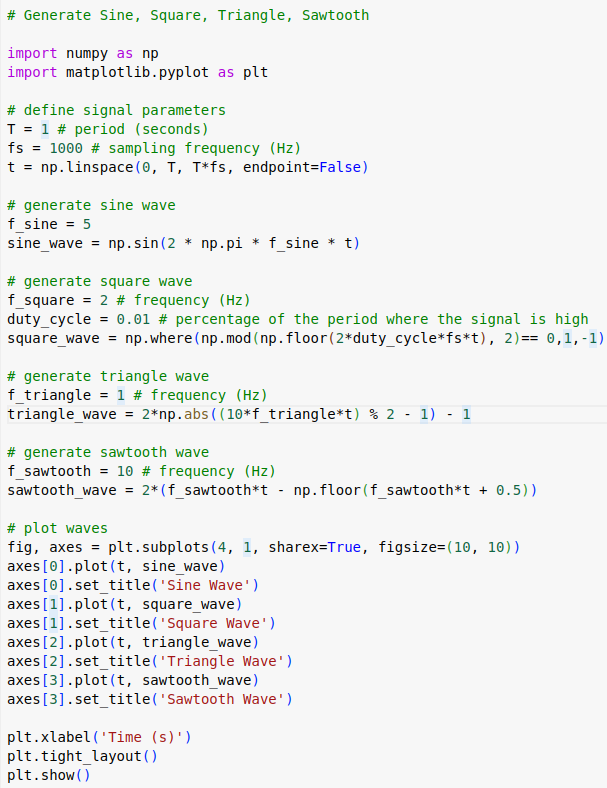
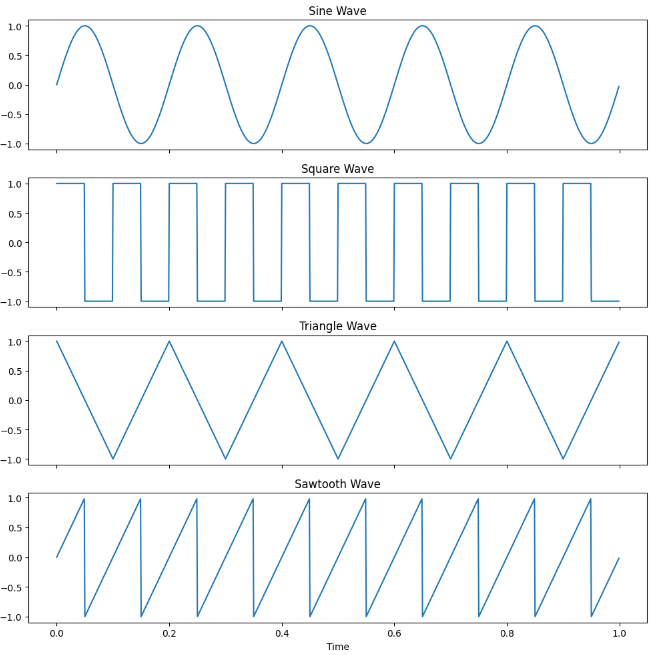
Data Visualization : Generate Sine, Square, Triangle, Sawtooth
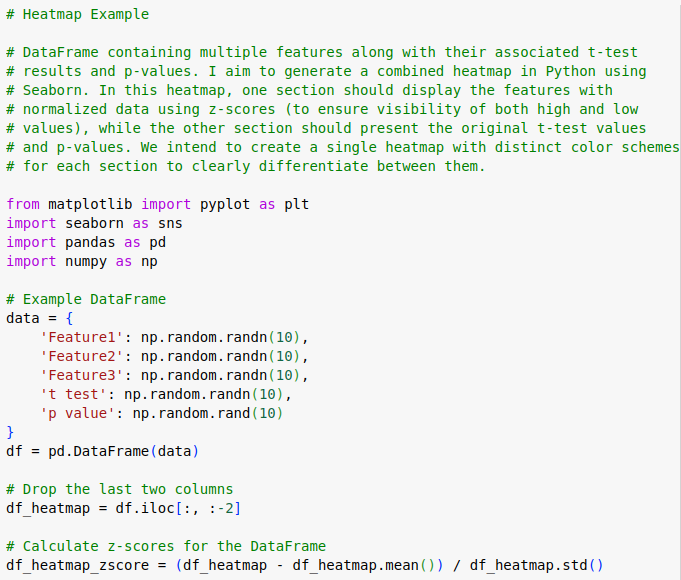
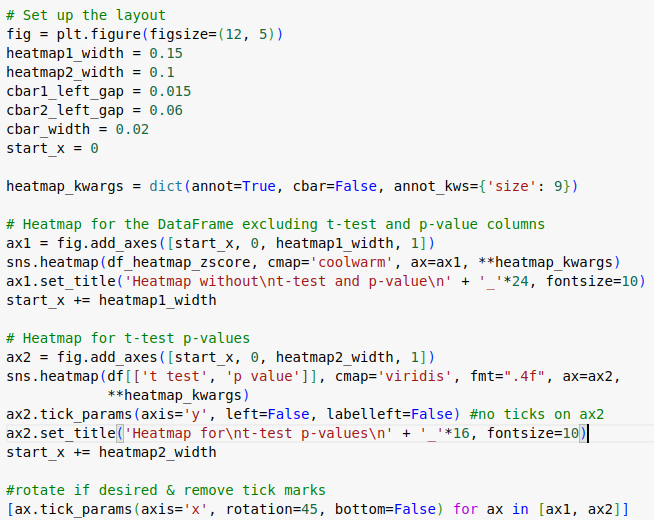
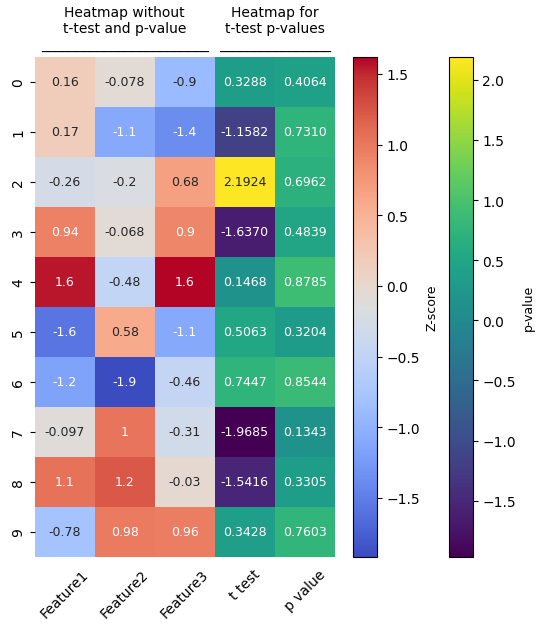
Data Visualization : Heatmap Example

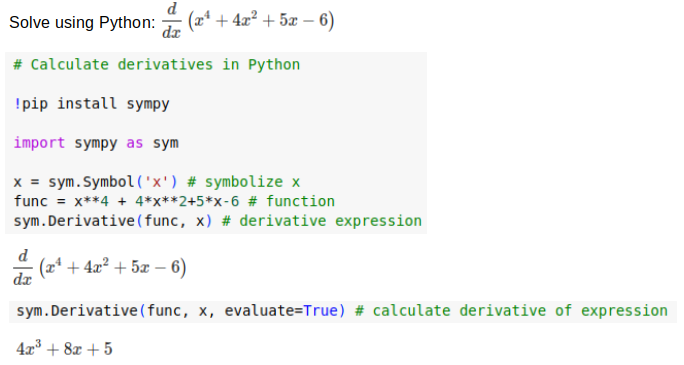
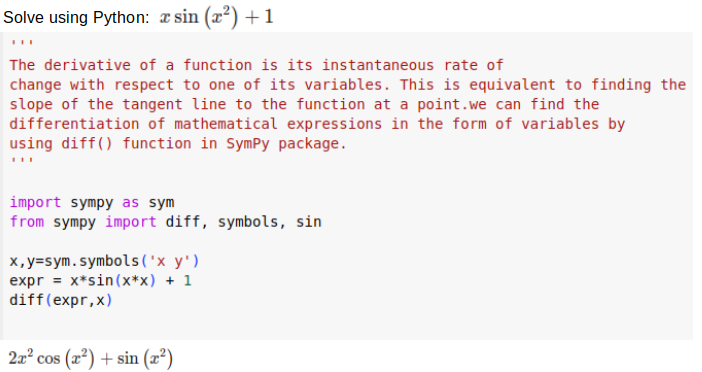
Calculus : Derivatives of a function
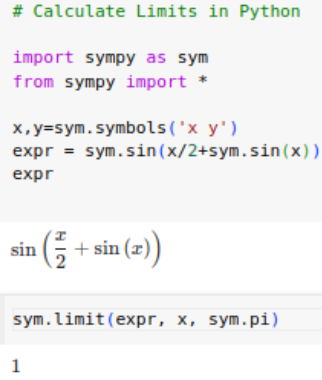
Calculus : Limits Example
Calculus : Trig function example
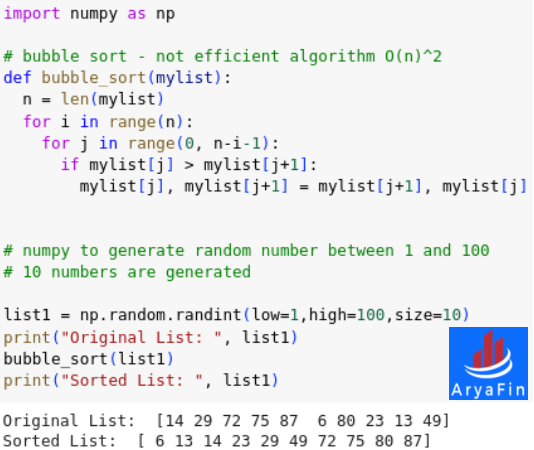
Understanding Bubble Sort:
Bubble sort is a simple sorting algorithm that repeatedly compares adjacent elements in a list, swapping them if they are in the wrong order, effectively causing larger elements to "bubble up" to the top of the list until the entire list is sorted; it's considered a basic sorting method due to its straightforward approach but can be inefficient for large datasets due to its time complexity of O(n^2).
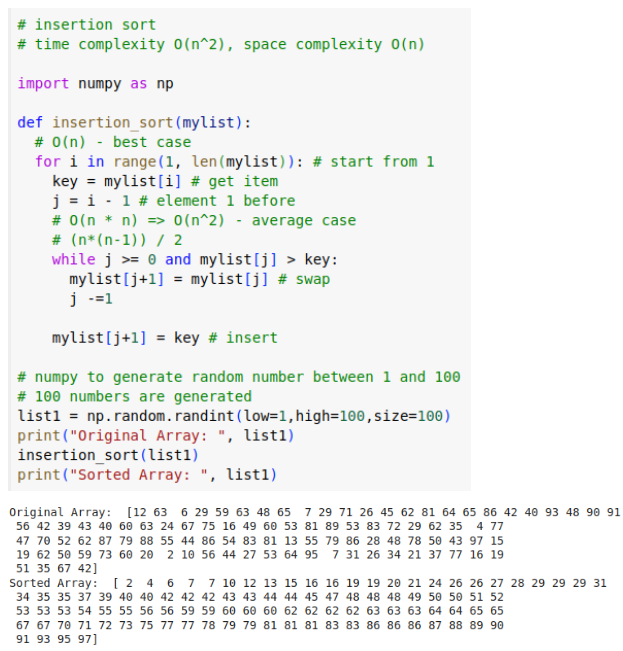
Understanding Insertion Sort:
The Insertion Sort algorithm uses one part of the array to hold the sorted
values, and the other part of the array to hold values that are not sorted yet.it's considered
a basic sorting method due to its straightforward approach but
can be inefficient for large datasets due to its time complexity of O(n^2).
1. Take the first value from the unsorted part of the array.
2. Move the value into the correct place in the sorted part of the array.
3. Go through the unsorted part of the array again as many times as there are values.
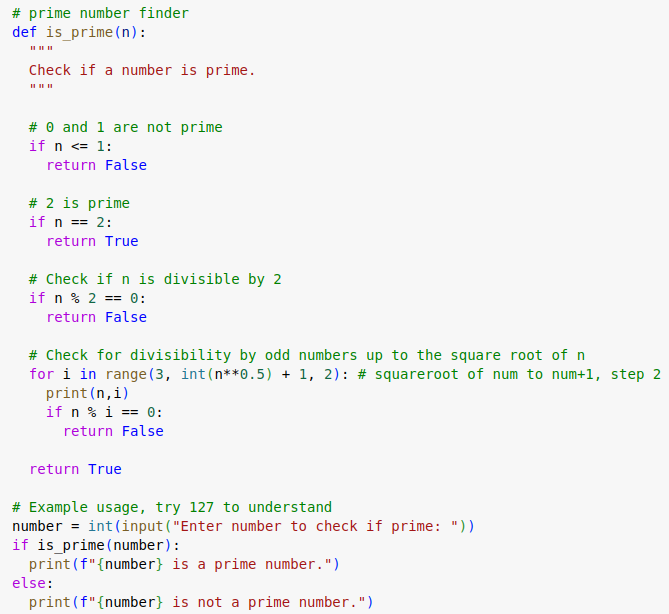
Find if a number is prime:
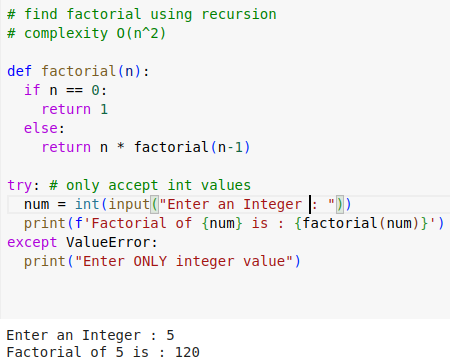
Factorial using recursion:
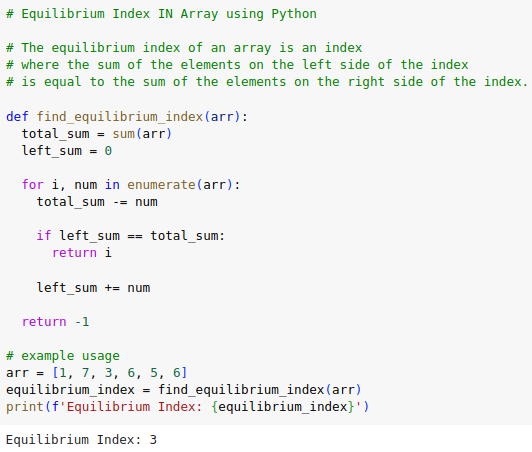
Equilibrium Index IN Array using Python:
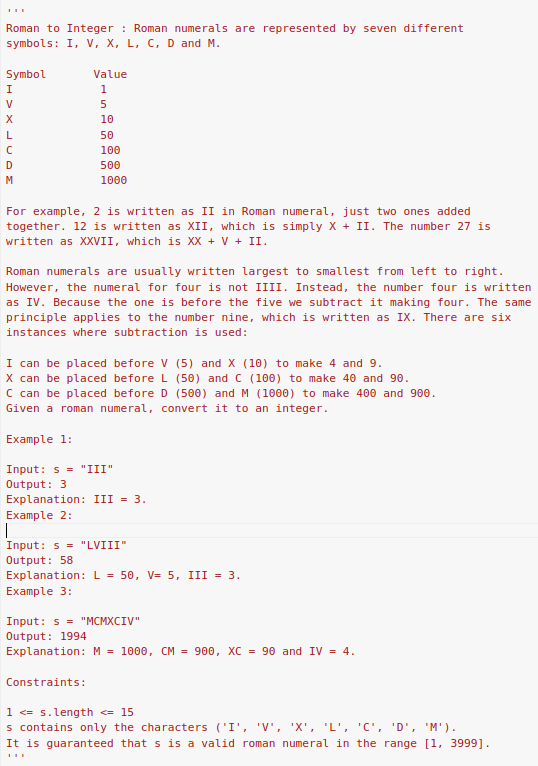
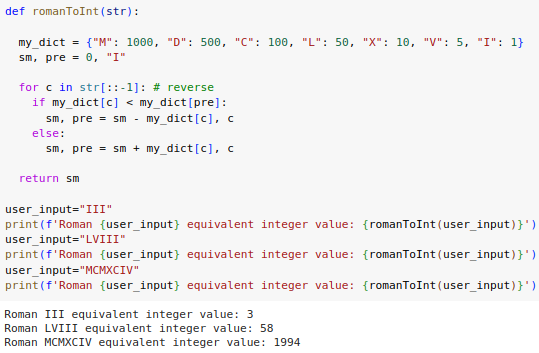
Roman to Integer: Leet Problem
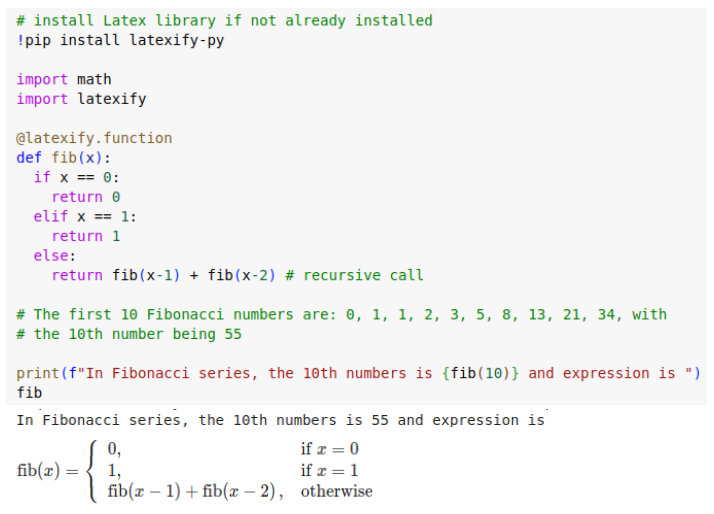
LaTeX math description from Python functions (Fibonacci Example):
Below shows how to use LaTex library using a simple Fibonacci series.
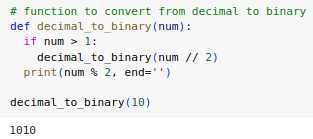
Convert from decimal number to binary
Recursive call.
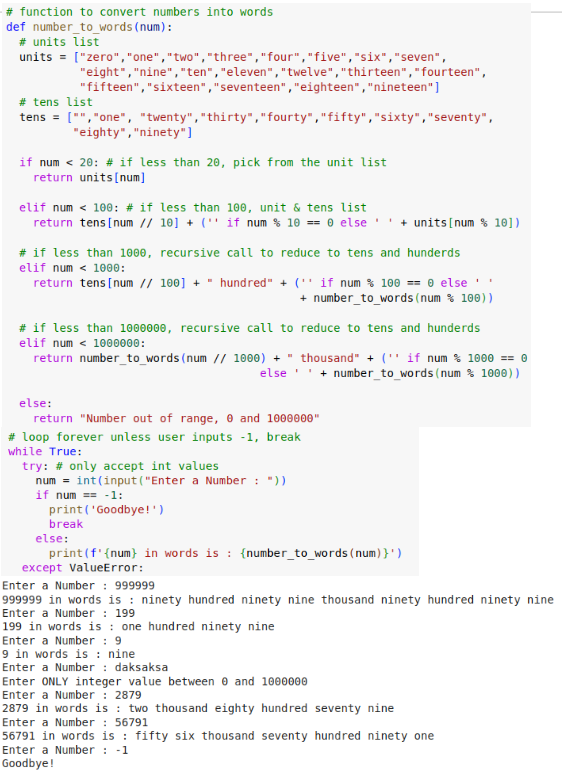
Program to convert input from user as integer between 0 and 100000 into a word.
Also shows exception handling and continous loop.
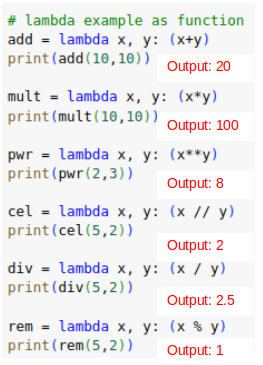
Lambda examples as function
Lambda Examples
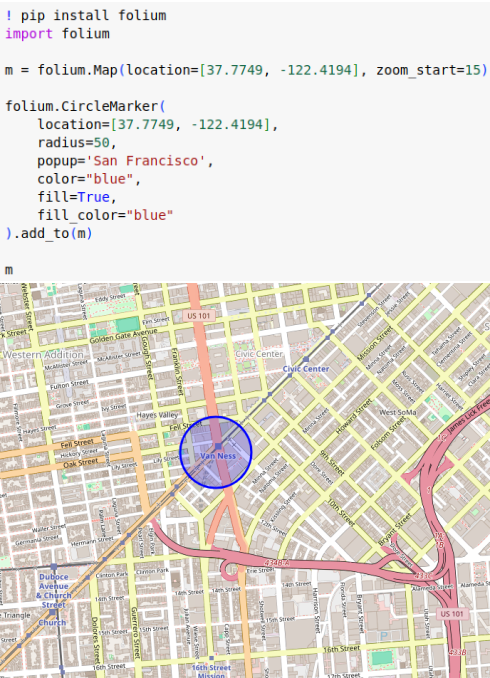
Show Map using Folium Library:
Map of San Francisco using local coordinates.
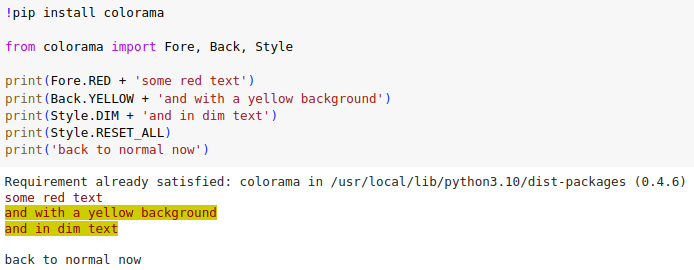
Learning Colorama
Using colorama we can have colorful console output.
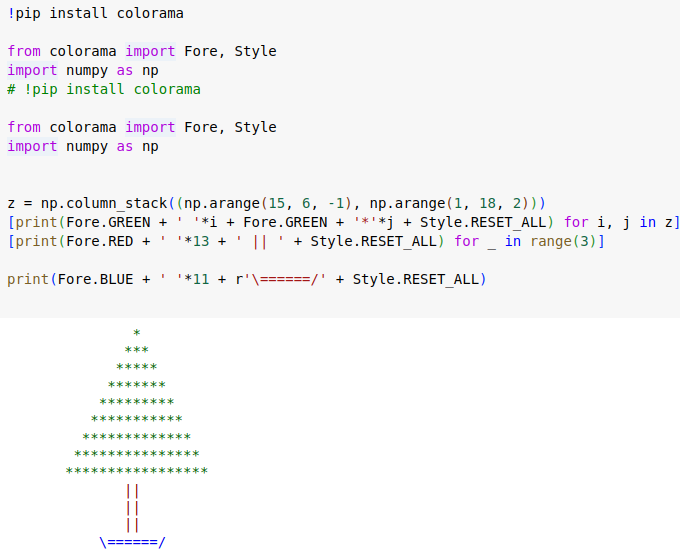
Christmas Tree using Colorama
Using numpy and colorama.
Happy New Year using Colorama
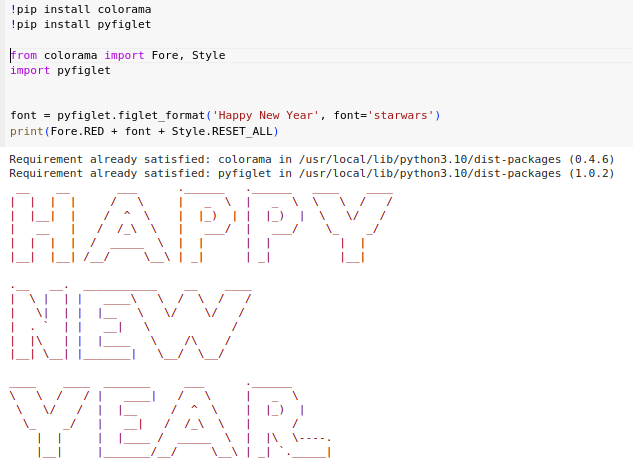
Happy New Year using Word Cloud API

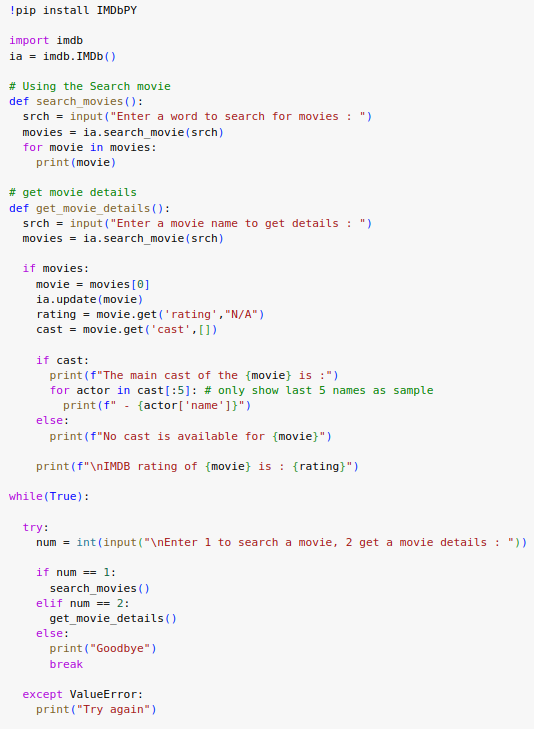
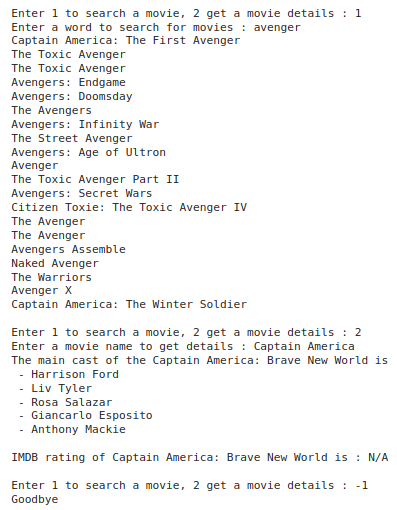
IMDB Movie Search API example
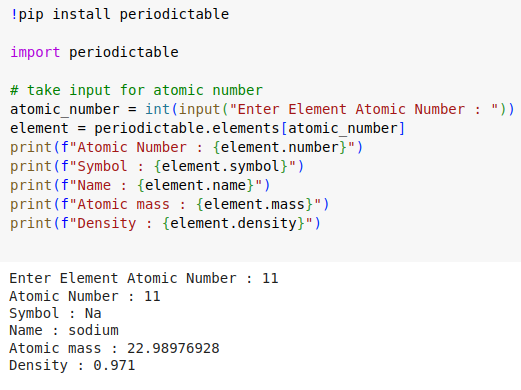
Chemistry Facts and Periodic Table API
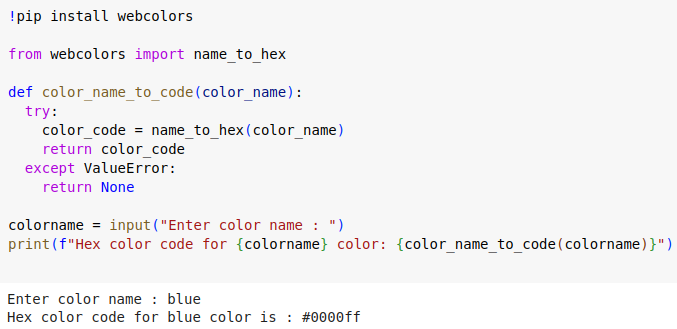
Find Hex Code for a Color using webcolors API
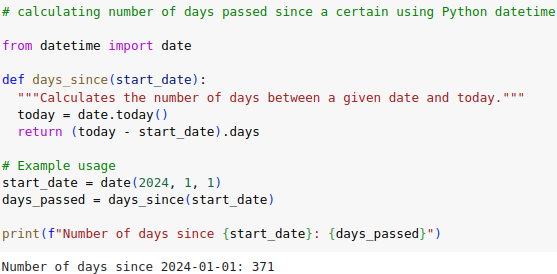
How to calculate number of days passed in Python
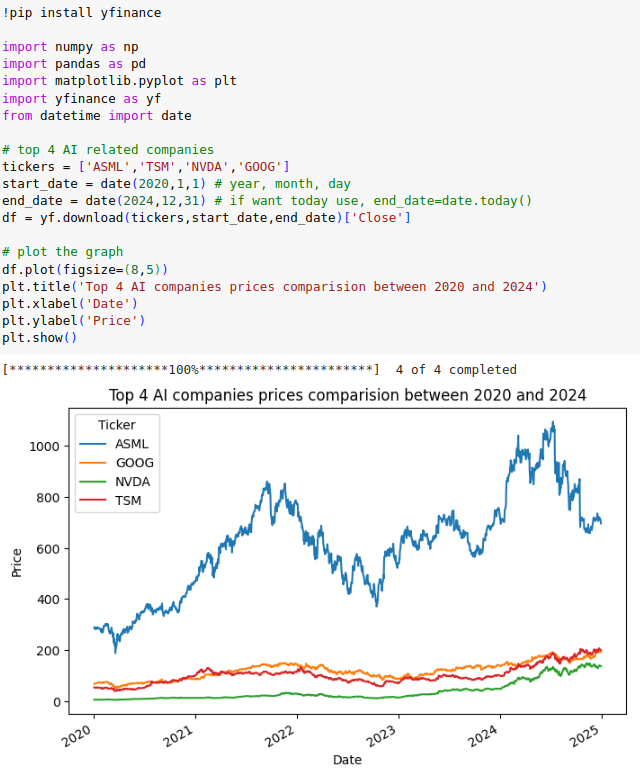
Comparing 4 AI in the world
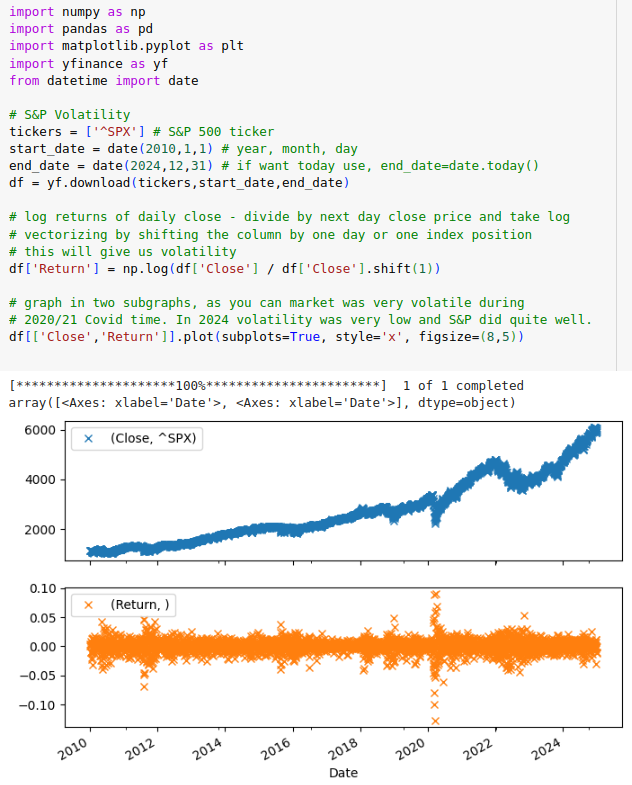
S&P 500 Volatility Analysis
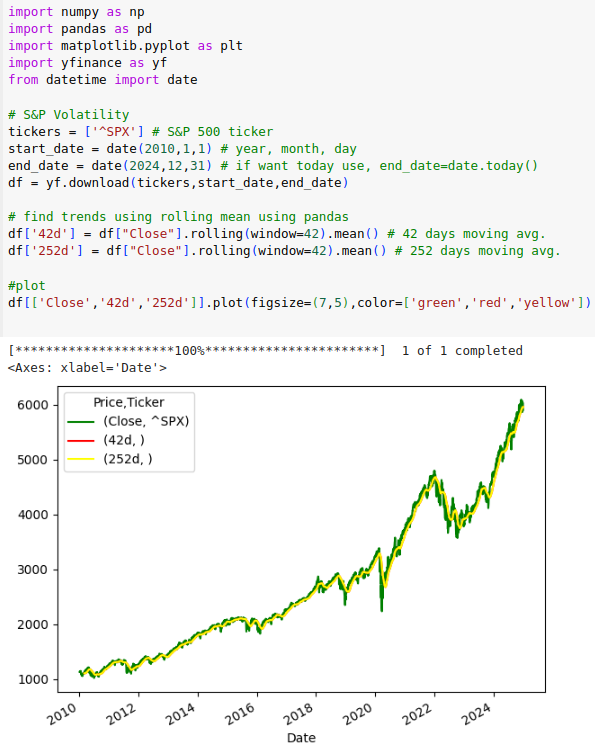
S&P 500 Trend Analysis using rolling mean of Pandas
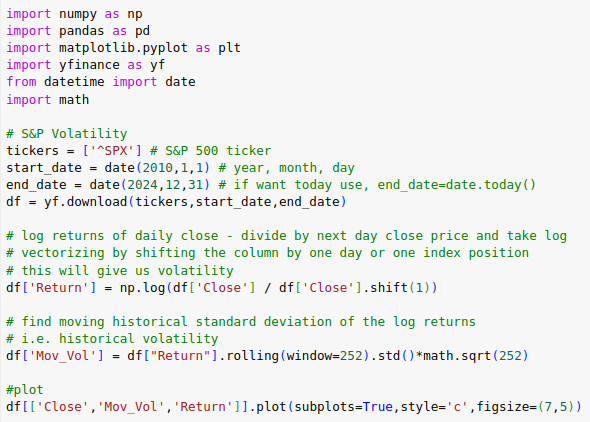
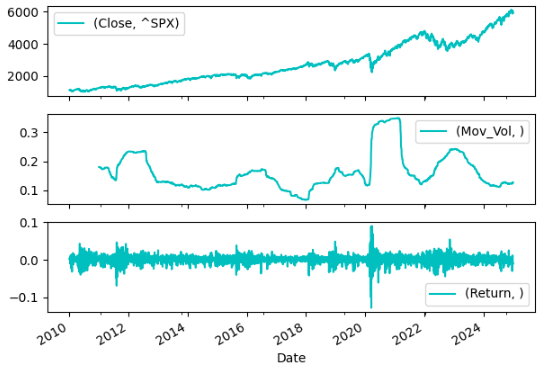
S&P 500 Historical Volatility Analysis using rolling std dev.
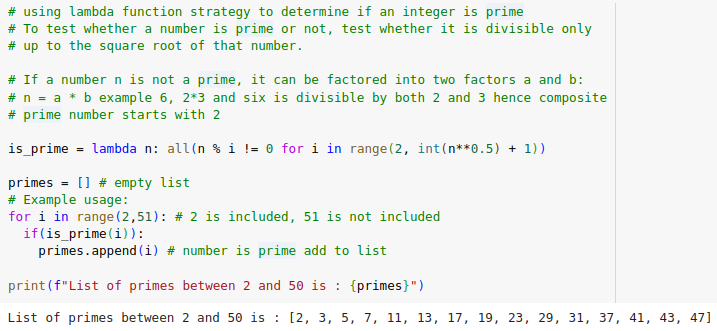
Using Lambda Function to find if a number is prime
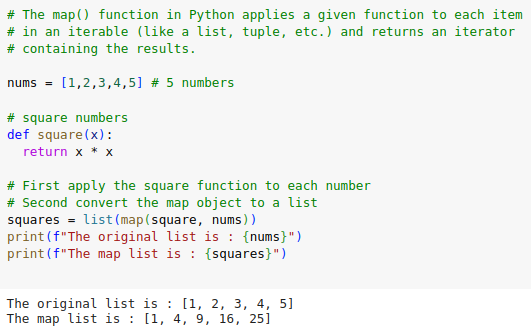
Understanding Python Map Function
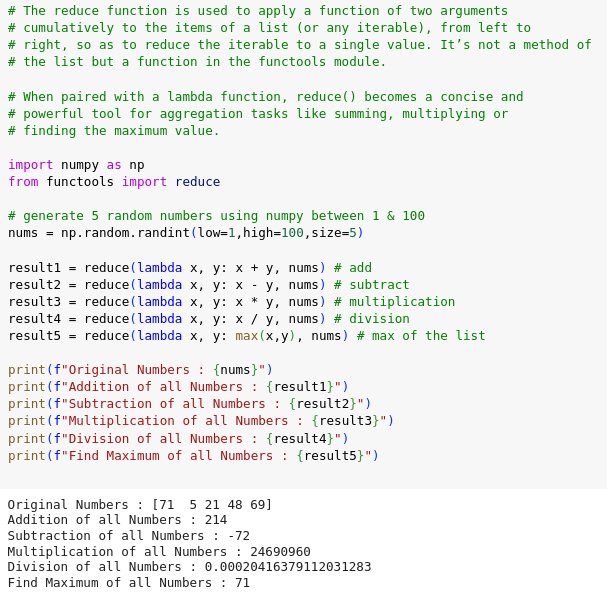
Understanding Python Reduce Function
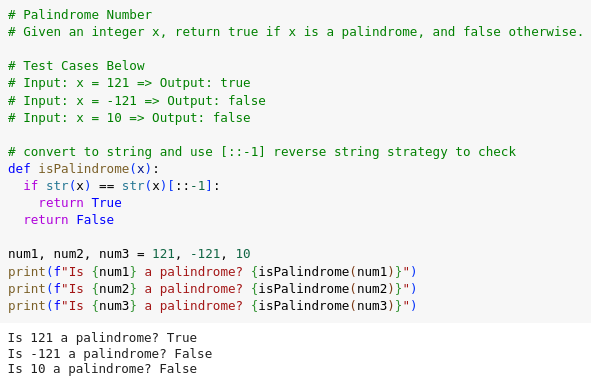
Palindrome Number finder, quick strategy
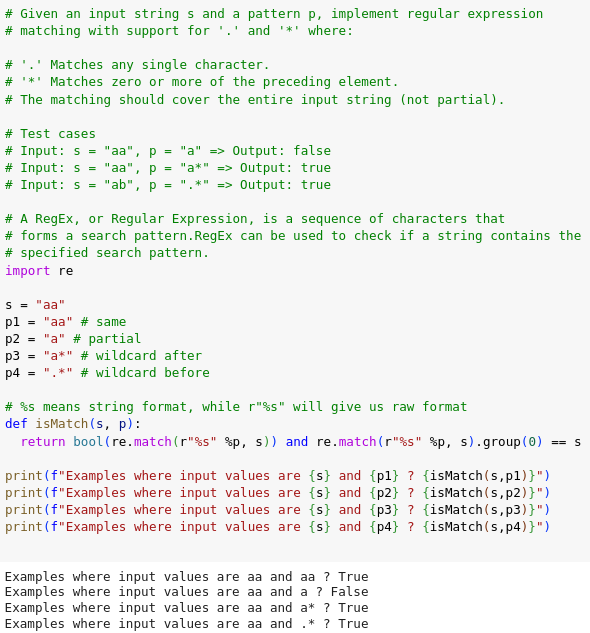
Python Regular Expression
Given an input string s and a pattern p, implement regular expression
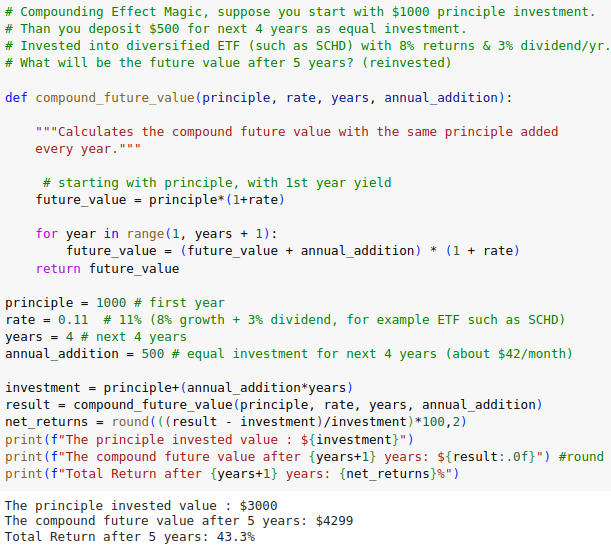
Compounding Effect Magic : A simple Investment Strategy
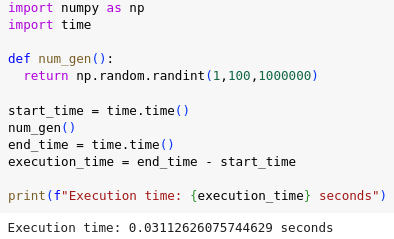
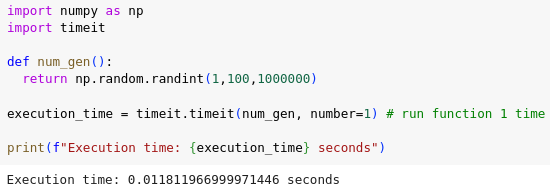
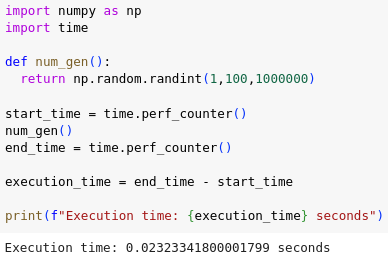
Three different approaches to find Python Method Execution Time
No preferences but I like 2nd approach of timeit.timeit(name_of_func,number=times) approach better
as this allows to call function multiple times.
Approach 1
Approach 2
Approach 3
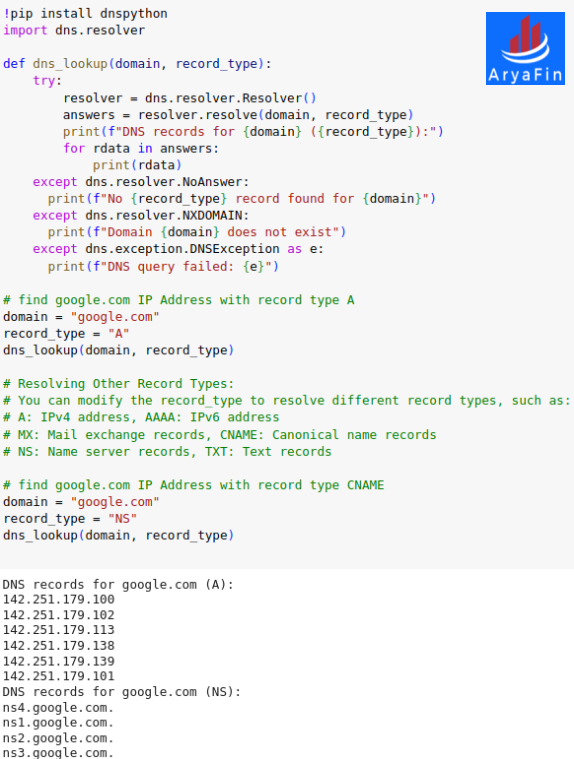
Using Python to find DNS and Other Valuable info
Python offers a powerful library called dnspython to work with DNS records.
Here's how you can use it to resolve DNS records:
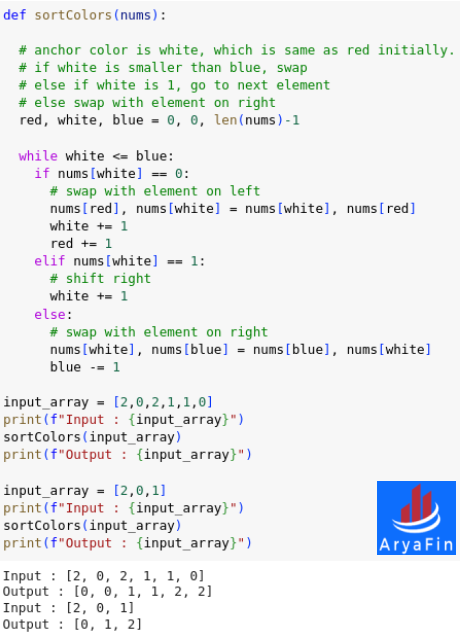
Sort Color Problem
Without using inbuilt sort functon, sort a list of O's, 1's, and 2's.
Given an array nums with n objects colored red, white, or blue,
sort
them in-place so that objects of the same color are adjacent,
with the colors
in the order red, white, and blue.
We will use the integers 0, 1, and 2 to represent the color red, white, and
blue,
respectively. You must solve this problem without using the
library's sort function.
Example 1:
Input: nums = [2,0,2,1,1,0]
Output: [0,0,1,1,2,2]
Example 2:
Input: nums = [2,0,1]
Output: [0,1,2]
input_array.sort() is not allowed
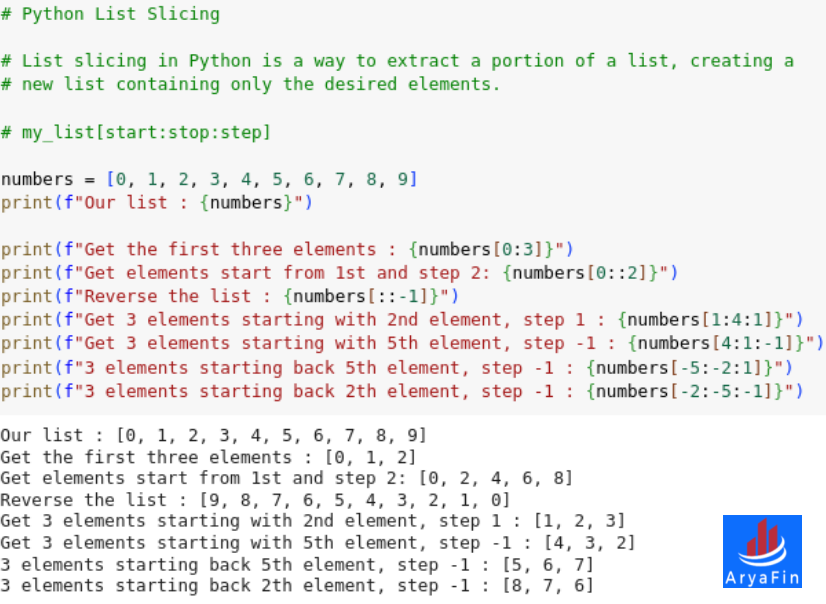
Python List Slicing Example
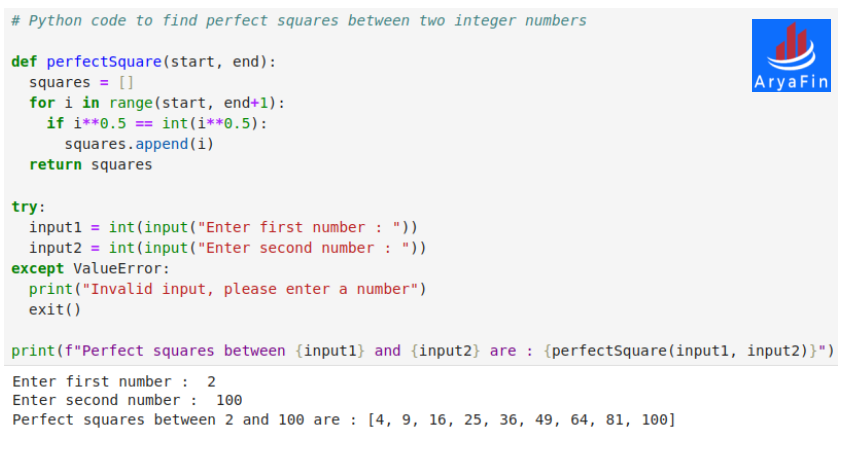
Find Perfect Square between two integers
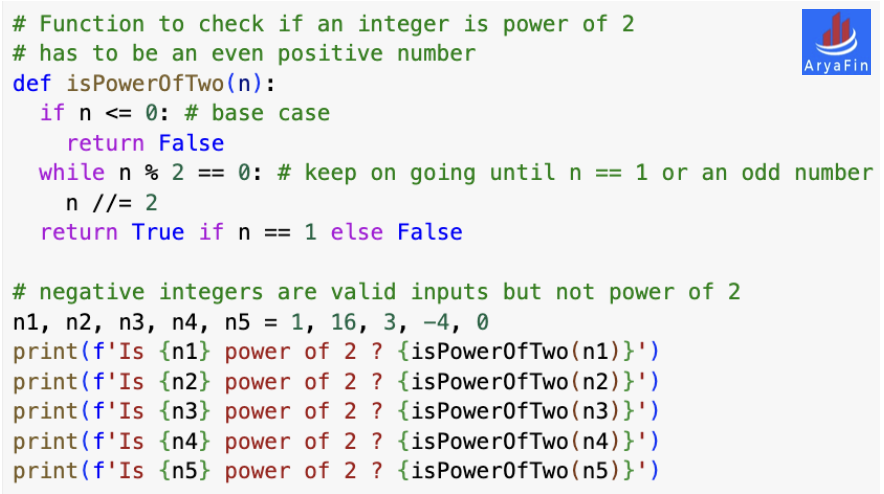
Power of Two - Easy Leet Code Problem
Given an integer n, return true if it is a power of two. Otherwise, return false.
An integer n is a power of two, if there exists an integer x such that n == 2x.
Input: n = 1, Output: true
Input: n = 16, Output: true
Input: n = 3, Output: false
Constraints: -231 <= n <= 231 - 1
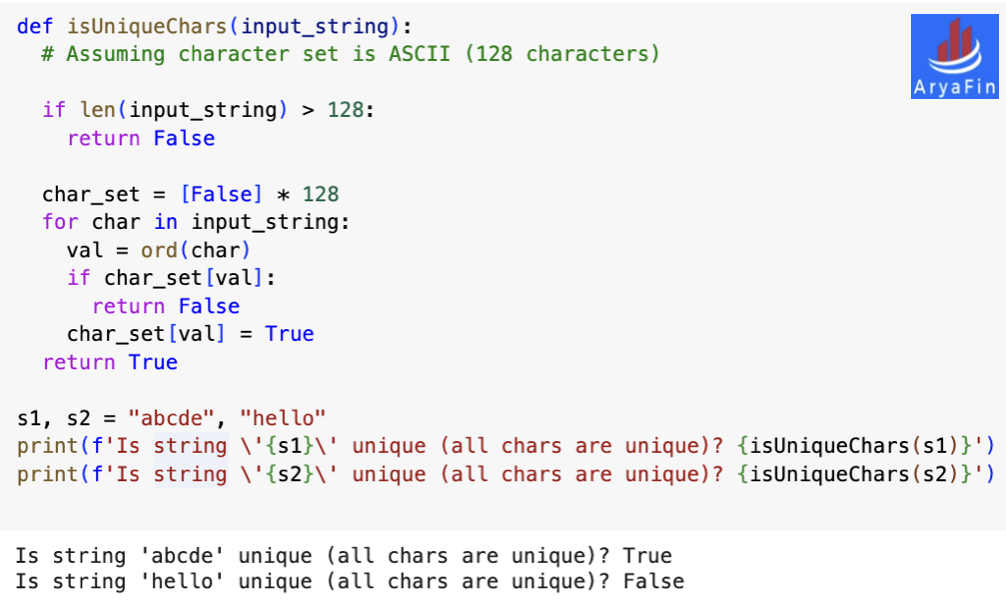
Is Unique Character String Problem
Problem : Implement an algorithm to determine if a string has all unique
characters. What if you cannot use additional data structures?
Input : "abcde", Output : True
Input : "hello", Output : False
Constraint : Assuming character set is ASCII (128 characters)
Complexity : O(n) where n is length of string, Space O(1), where n <= 128,
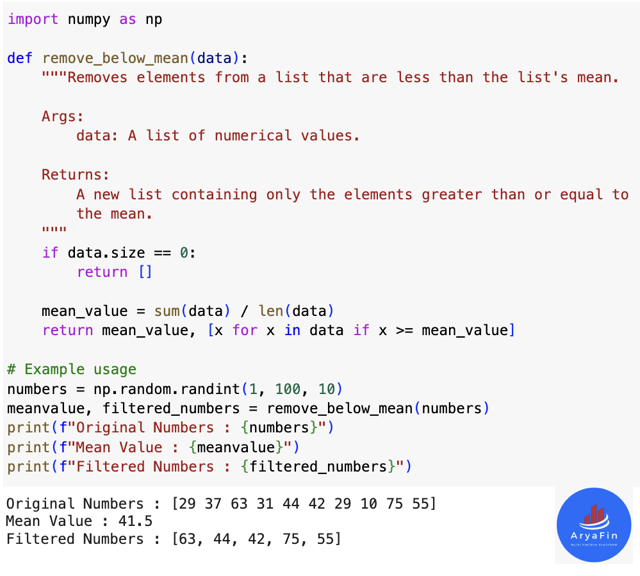
Remove Values Below Mean from a List
Problem : Removes elements from a list that are less than the list's mean.
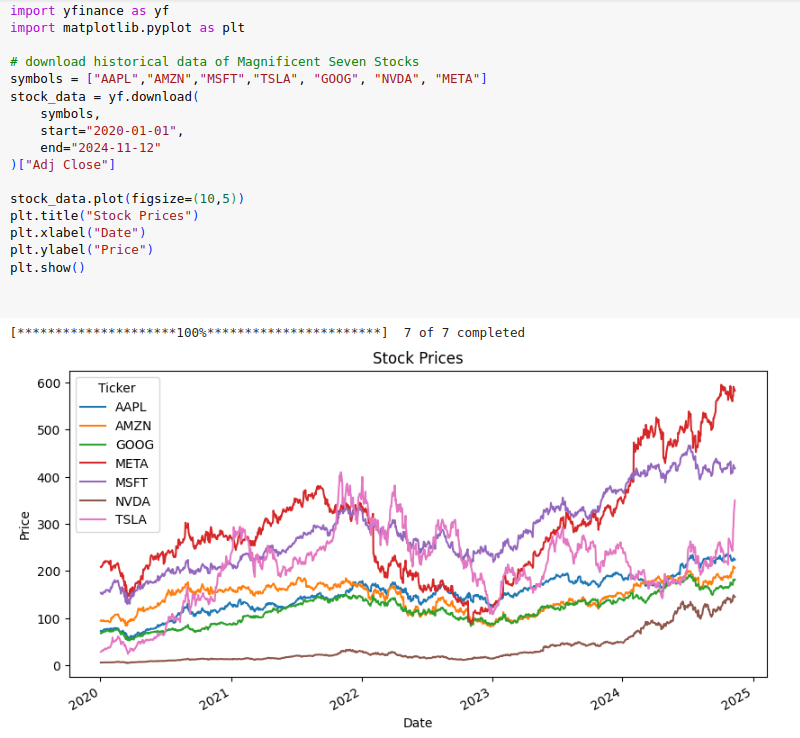
ML Algorithms Chart
