Weekly Market Commentary - Sept 14th, 2024 - Click Here for Past Commentaries
-
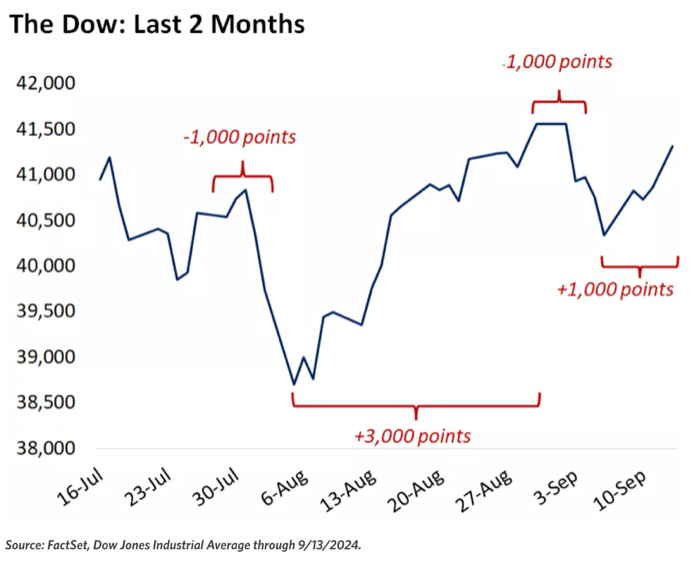
Market swings have increased in recent weeks, as anxiety of a slowing economy
and persistent inflation is sparking pullbacks. But a broader view shows
that despite sell-offs, stocks have delivered very strong gains and sit
near record highs. See below last 2 years Dow performance.

-
The latest read on inflation was released last week, with a less-than-receptive
initial response from the market, as the month-over-month increase in core CPI
showed that the last mile of the inflation fight will not be completely smooth.
Despite the challenges month-to-month, the broader path for inflation remains
on a downtrend, with core CPI now back to levels last seen in early 2021.
-
Markets were forced to lower hopes for a bigger rate cut from the Fed at its
September meeting, but we think the bigger picture for monetary policy is a
bright one, with the Fed likely to start an extended phase of rate cuts at
its meeting this coming week. Meanwhile, active traders are having a field
day. See chart below.
-
Investors focused in on inflation data last week, with markets continuing to
filter the balance of consumer price trends and economic readings through
the lens of what it means for Fed interest-rate moves ahead. Recent
developments have produced flashes of market volatility lately, but this
isn't necessarily the full image. Let's zoom in on a few key items that
were in the frame last week, and then zoom out for a better view of
the bigger picture for the markets.
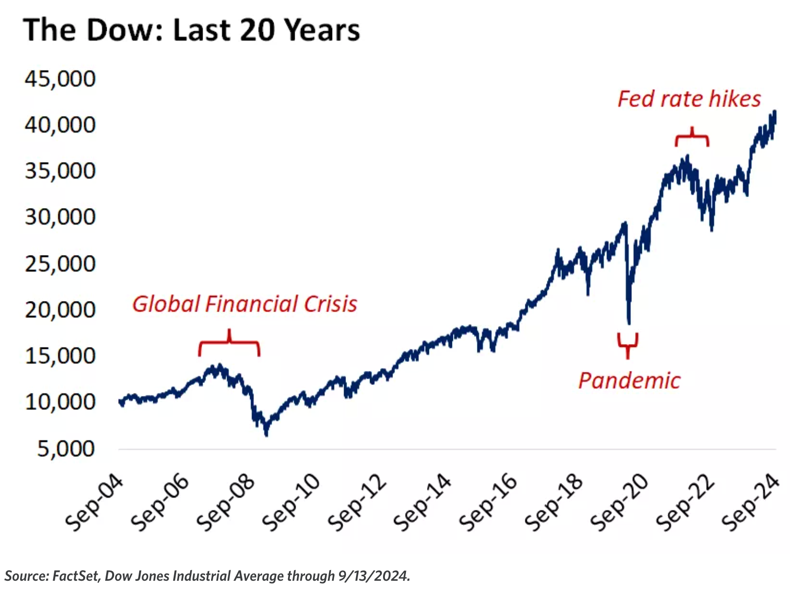
On August 5, the Dow fell 1,034 points. It then rose 1,062 points over the next six days. Almost another 2,000 points were added over the ensuing few weeks, followed by a drop of 1,000 points from August 29 to September 6. Then on Wednesday of last week, the Dow had an intraday swing of 910 points (rising by that amount in a matter of a few hours). Last 20 years of Dow, see below
-
For context, this winding path was prompted by a batch of data that
spurred a retake on the outlook for factors that have been rather
reliable and steady characters in the investment landscape over the
last year and a half – a tight labor market and mega-cap tech stock
leadership. Specifically, the early-August sell-off was sparked by a
jobs report showing a slowdown in hiring growth that spurred a chorus
of recession calls. The late-August decline was a similar reaction to
a weak monthly manufacturing report. And last Wednesday's half-day
slump was the response to the consumer price index (CPI) report that
showed a stall in the pace of falling inflation.
-
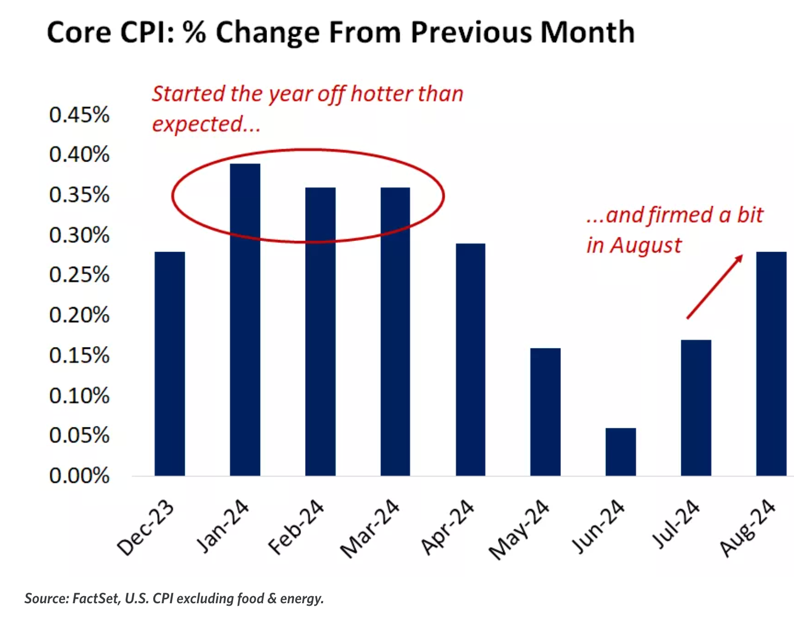
The latest read on inflation was released last week, with a less-than-receptive
initial response from the market, as the month-over-month increase in core CPI
showed that the last mile of the inflation fight will not be completely smooth.
On an annual basis, core inflation held steady at 3.2%.1 On one hand, this is
half of where we were at the peak, but on the other hand, this was flat with
the previous reading and still above the Fed's broader target of 2%.
-
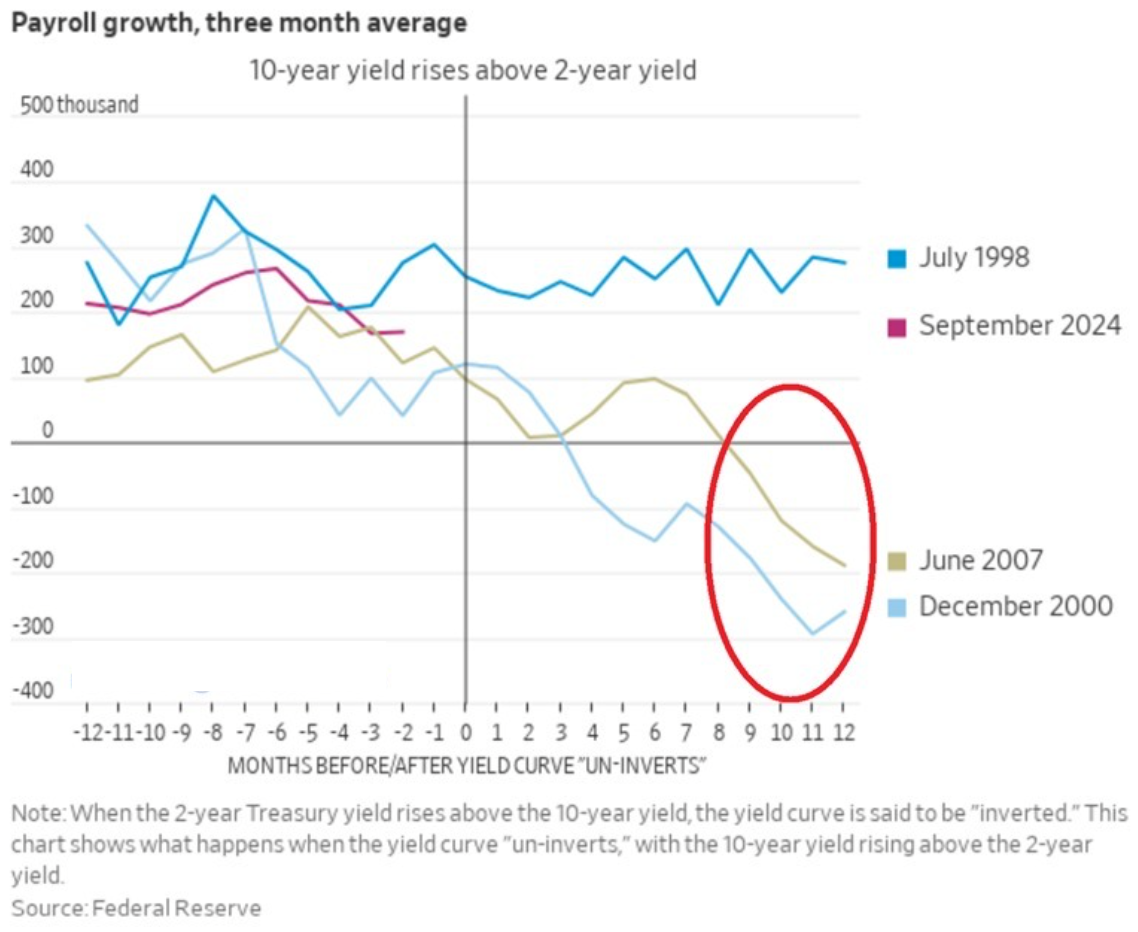
The yield curve just turned positive after 565 consecutive sessions of inversion,
ending the longest streak in history. Over the last 45 years, each time the yield
curve un-inverted, the number of jobs within the economy materially dropped within
the next 12 months, except for in 1998. In 2000, the 3-month average job decline
reached a whopping ~280,000 within a year of the yield curve turned positive.
In 2007, job declines hit ~190,000 in 12 months after the yield curve turned positive.
If history is any guide, we expect more labor market weakness.
-
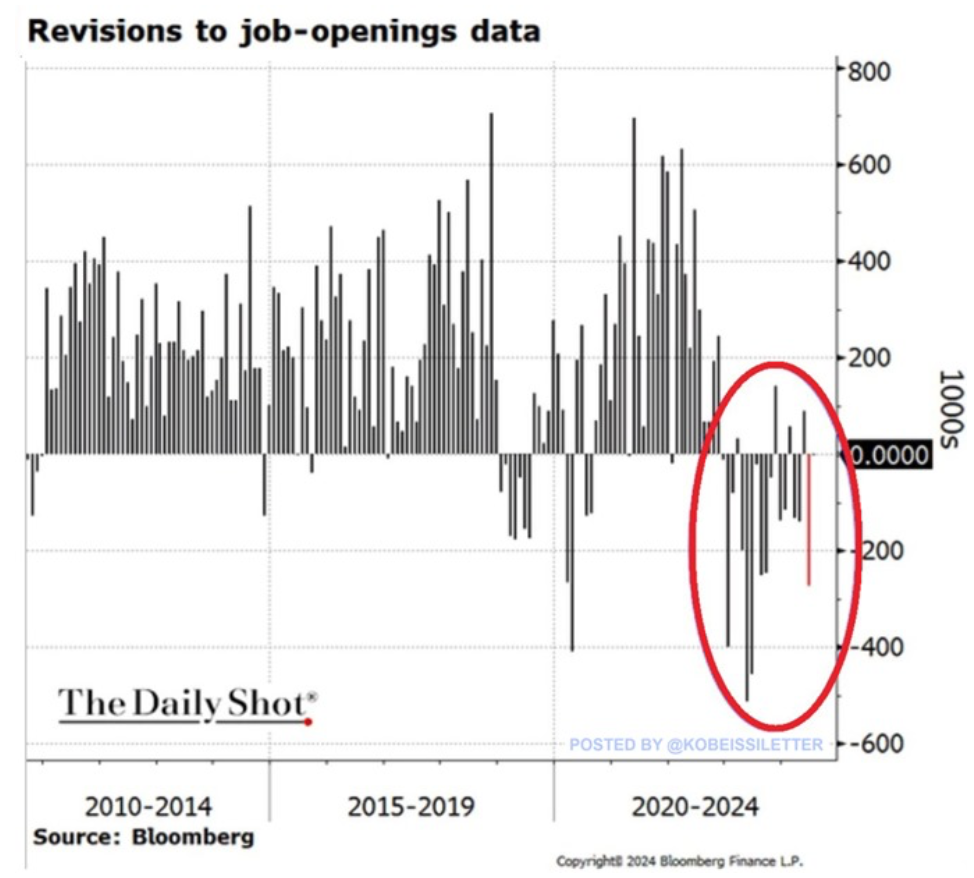
US job openings data has been revised downward in 15 of the last 19 months, the
longest streak since 2008. The number of job vacancies has been regularly revised
down over the last 18 months, with the largest adjustments reaching over 500,000.
The most recent release for June was lowered by a massive 274,000 openings from
the initially reported 8.18 million, the fourth largest revision since 2020.
Meanwhile, job openings for July came at 7.67 million, the lowest since January
2021. If this number is revised down again, job vacancies would likely be below
pre-pandemic levels.
-
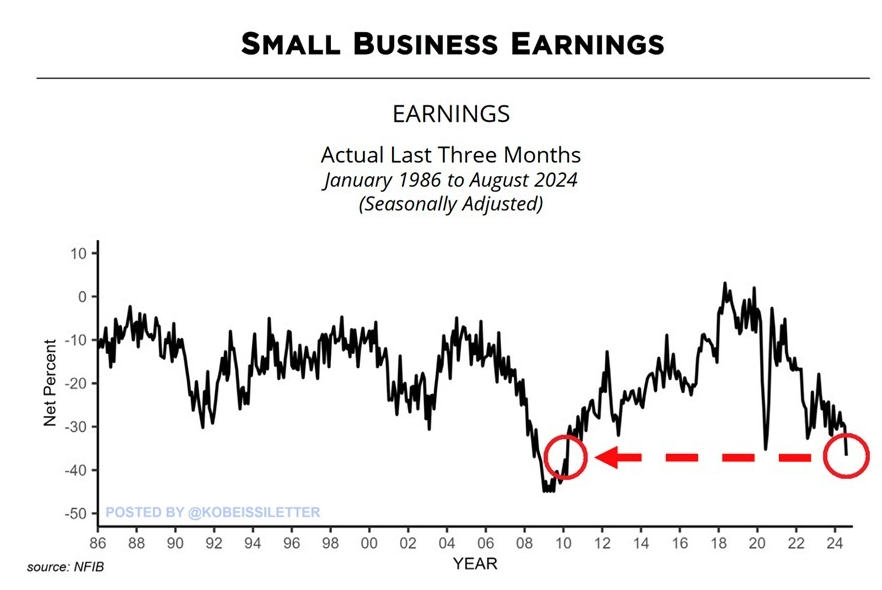
Small businesses are struggling. 37% of US small businesses have seen their earnings
drop over the last 3 months, the highest share in 14 years. This is even weaker than
the 35% seen during the 2020 pandemic.
-
Nearly all of the lack of progress in this most recent inflation reading is
attributable to shelter (rents, homes) prices, which rose by a higher-than-expected
0.5% versus the prior month. The remainder of the CPI report was actually encouraging,
with prices declining for categories like used vehicles, personal and medical care,
recreation and home furnishings.
-
We think the lack of accelerated moderation in core inflation in this report all but
eliminates the probability of the Fed cutting by an outsized 50 basis points (0.50%)
at its upcoming meeting. While futures markets moved in recent weeks to price in a
rising expectation for a larger rate cut, we never subscribed to this view, as we
don't think the labor market or economic backdrop warrant a more extreme policy
response. We suspect the initial weak reaction in the financial markets to this
inflation report were a function of markets shaving off hopes for a bigger rate cut.
-
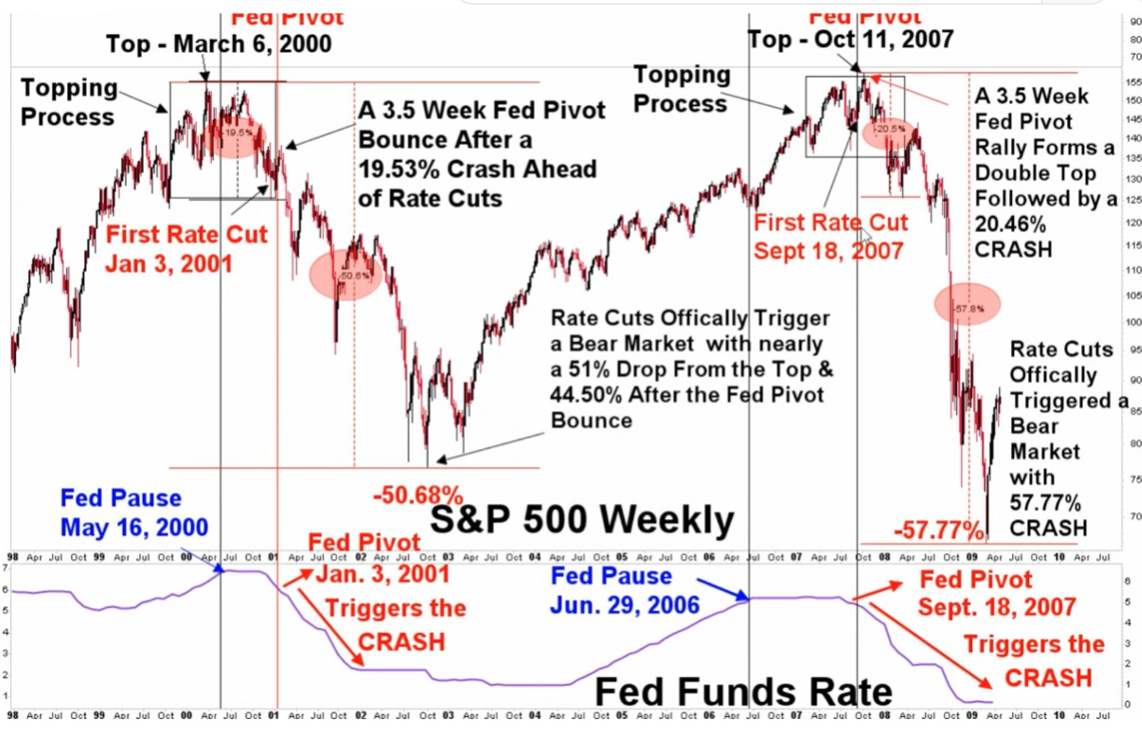
Fed Pivot Analysis, will it trigger a crash in coming months? See below.
-
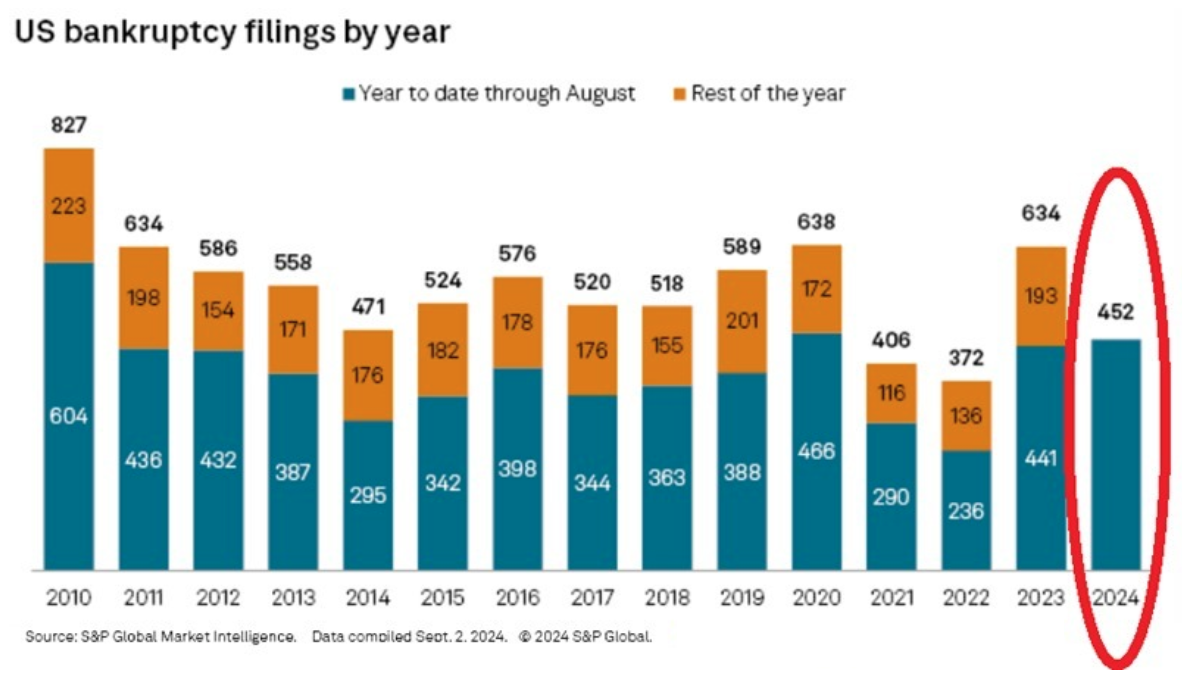
Alarming, 452 large companies have now declared bankruptcy year-to-date, the 2nd highest
number in 14 years. This is only below the 466 bankruptcies recorded in 2020
when economic activity was halted by lockdowns.
-
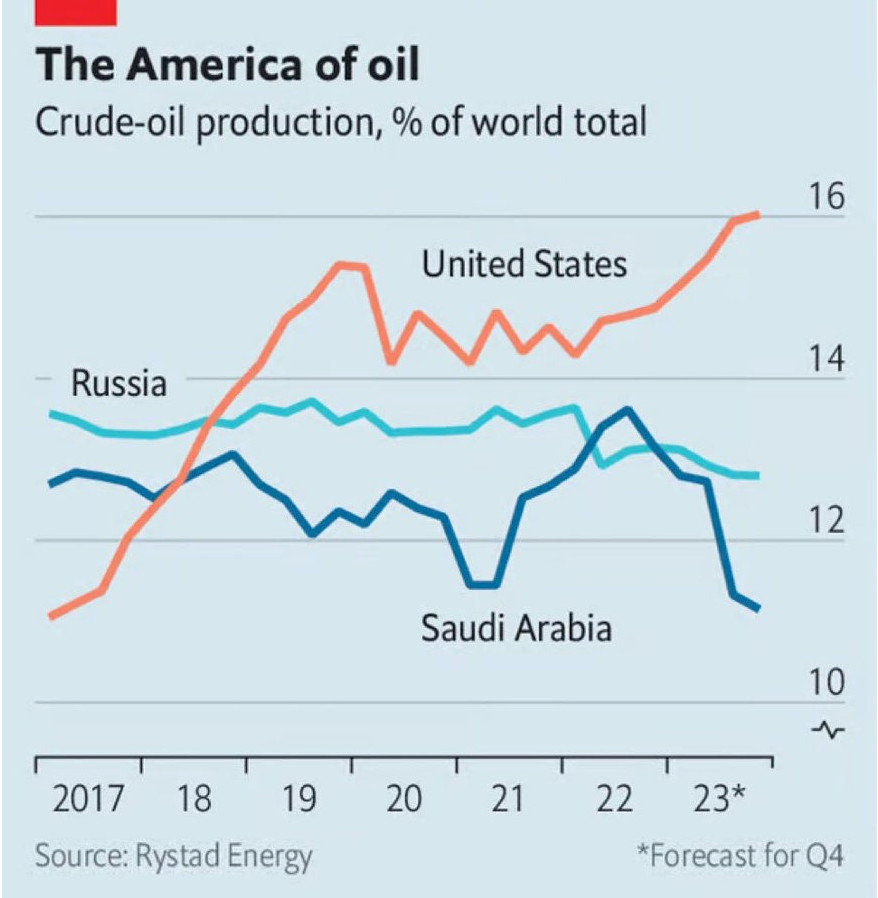
Fun fact, The US now produces 50% more oil than Saudi Arabia
-
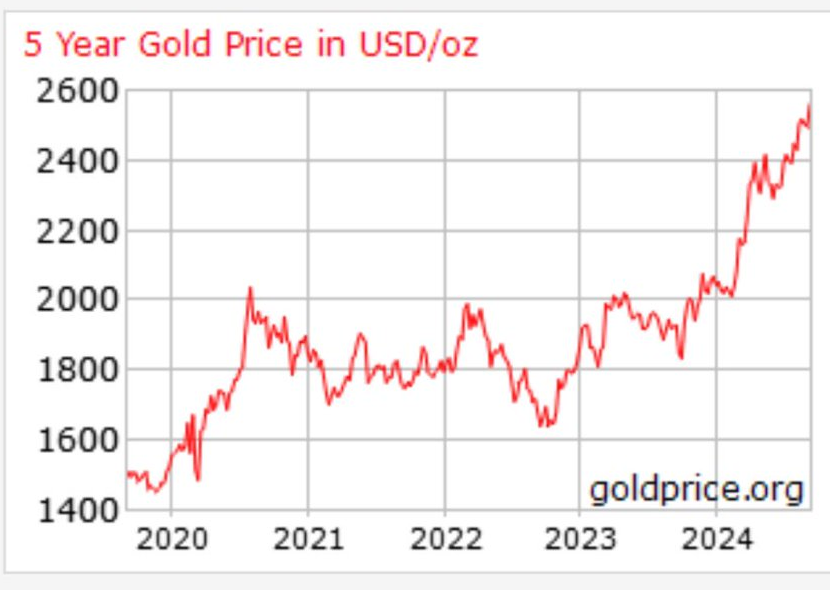
Here are two ways to look at the below chart. Either the price of gold is rising, or the dollar is
losing value. This is what happens when the government prints trillions of dollars out of
thin air.
-
Word of Caution: Markets are clearly expressing more caution across
asset classes, perhaps rightfully so after a strong rally and weakening economic
data. CNN Business Fear & Greed Index is shown below.
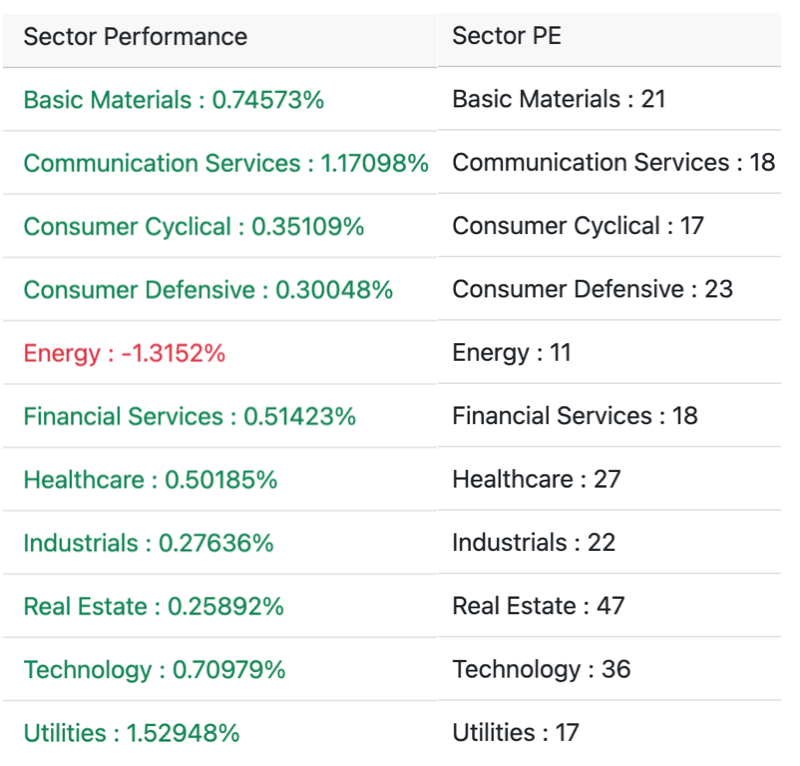
Below is our daily sector performance report - warrants caution.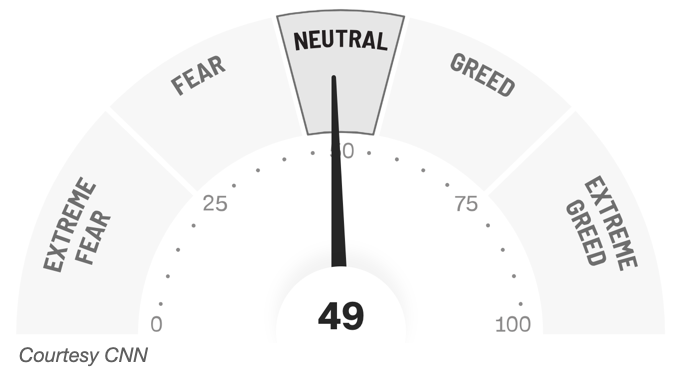
If you are looking for investment opportunities, you can take a look at our
Hidden Gems
section, and if you want to see our past performance, visit our
Past Performance section. If you are looking for
safe and low cost Exchange Traded funds(ETFs), check out our
ETF recommendations.
