Weekly Market Commentary - Oct 25, 2025 - Click Here for Past Commentaries
-
Bull market turns 3 — Since bottoming in October 2022, the S&P 500 has gained 90%, an impressive run but not
unusual by historical standards.
Cooler inflation supports the Federal Reserve’s shift — Softer September inflation likely clears the way for an October interest rate cut, with more easing expected into 2026. The Fed may also signal an end to quantitative tightening, reinforcing a supportive backdrop for equities.
Earnings to take the lead — With valuations near cycle highs, corporate earnings growth is poised to drive the next phase of the bull market. Q3 results so far show resilience despite trade and labor headwinds.
Positioning for broader leadership — We maintain an overweight to equities but expect leadership to broaden beyond mega-cap tech. Opportunities are emerging in cyclicals (industrials, consumer discretionary), health care, and international small- and mid-cap stocks.
Stocks continue to climb the proverbial wall of worry as the bull market celebrates a significant milestone this month: its third birthday. Equities bottomed in October 2022, having declined nearly 25% amid peak inflation. Just a month later, ChatGPT's release ignited a powerful rally in the tech-heavy Nasdaq.
That wall of worry has grown taller recently, with renewed China tensions ahead of key November trade deadlines, a slowing labor market obscured by a government data blackout, and growing valuation concerns for AI-driven stocks.
While these headwinds offer valid reasons for a pause, we believe the bull market has room to run and will celebrate another anniversary next year.
-
Since the October 2022 low, the S&P 500 has gained 90%, or 98% including dividends.¹ No doubt it’s been an impressive
run, but this bull market isn’t an outlier in strength or length. Over the past 80 years, the 12 prior bull markets
(excluding the current one) averaged about 200% gains and lasted five years. Notably, eight surpassed three years,
with the longest (2009–2020) stretching 11 years.
So, this bull market is neither a toddler nor a senior citizen—it’s somewhere in the middle. While history provides context, fundamental conditions will shape what comes next. As the saying goes, bull markets don’t die of old age—they end from recessions or Federal Reserve tightening. We believe neither is likely in 2026.


-
The ongoing government shutdown has delayed key economic data releases, including the jobs report, which the Fed
relies on to guide policy decisions. However, because the Social Security Administration requires inflation data
to calculate next year’s cost-of-living adjustment (COLA) for over 70 million recipients, the Bureau of Labor
Statistics recalled furloughed workers to release the September CPI report.
Inflation came in softer than expected, with headline CPI rising 0.3% from the prior month (versus expected 0.4%). The core index, excluding food and energy, rose 0.2% (versus expected 0.3%), the slowest pace in three months. On an annual basis, both metrics rose 3% (versus expected 3.1%), with the headline index ticking up and the core index ticking down.
Key contributors:
- Housing inflation slowed notably, with owners’ equivalent rent posting its smallest monthly increase since January 2021.
- Goods prices rose more slowly, helped by lower prices for used cars. Tariff-sensitive categories such as furniture and clothing rose at the fastest pace in a year, but their overall CPI impact remains small. - Services inflation excluding housing eased, aided by a drop in car insurance costs.
We believe this cooler inflation print gives the Fed a green light to cut interest rates at its Oct. 29 meeting, lowering the fed funds target range to 3.75%–4%, with a potential follow-up cut in December. While inflation remains above the Fed’s 2% target, recent signs of labor market softness, validated by the September ADP report in the absence of official data, suggest the Fed may continue moving toward a neutral policy stance. Additionally, the Fed may signal the end of quantitative tightening (balance sheet reduction), with a formal announcement likely later this year, or even potentially as soon as this week.
Bottom line: The Fed is unlikely to stand in the way of the bull market. In fact, its stance may become increasingly supportive through 2026, reinforcing the case for the uptrend in stocks to continue.

-
Barring a late-year correction, the S&P 500 is on track to notch its third consecutive year of double-digit returns,
pushing its price-to-earnings ratio to cycle highs. Valuations are likely approaching a ceiling, as investors may be
reluctant to pay the lofty multiples seen during the tech bubble. Corporate earnings will need to take the lead in
driving further market gains and extending the bull run.
Fortunately, the backdrop remains supportive. U.S. corporate profits continue to grow at a healthy pace, despite trade disruptions and a cooling labor market. The third-quarter earnings season, which began with the banks, is now picking up pace.
Over the next two weeks, nearly 60% of S&P 500 companies will report results, including the bulk of the Magnificent 7 (Alphabet, Amazon, Apple, Meta Platforms, Microsoft, Nvidia, and Tesla). This group is expected to post 15% year-over-year earnings growth, compared with 6.7% for the remaining 493 companies and 8.5% for the index overall.
So far, management commentary has emphasized consumer resilience, particularly among high-income households, along with stable credit quality and a pickup in mergers and acquisitions (M&A) activity. As tech giants begin to report, investors will watch closely for updates on AI-related spending.
This spending is projected to approach $400 billion this year, representing nearly one-third of total S&P 500 capital expenditures. The key question is whether these investments will begin to deliver returns. For now, however, investors appear willing to give these companies the benefit of the doubt.

-
Final Words: Market indicates fear. Buy VOO, VGT, and GLD (Gold).
Below is last week sector performance report.
Weekly Sector Performance for Oct 20-24, 2025:
$XLE Energy: 2.43%, RSI: 51.20
$XLK Technology: 3.01%, RSI: 64.76
$XLC Communication: 0.53%, RSI: 50.32
$XLY Consumer Discretionary: 1.38%, RSI: 52.82
$XLP Consumer Staples: -0.80%, RSI: 50.28
$XLF Financial: 1.78%, RSI: 50.65
$XLV Health Care: 1.93%, RSI: 69.43
$XLI Industrials: 2.10%, RSI: 56.04
$XLB Materials: 1.29%, RSI: 49.18
$XLRE Real Estate: 1.45%, RSI: 61.55
$XLU Utilities: -0.20%, RSI: 63.67

If you are looking for investment opportunities, you can take a look at our
Hidden Gems
section, and if you want to see our past performance, visit our
Past Performance section. If you are looking for
safe and low cost Exchange Traded funds(ETFs), check out our
ETF recommendations.
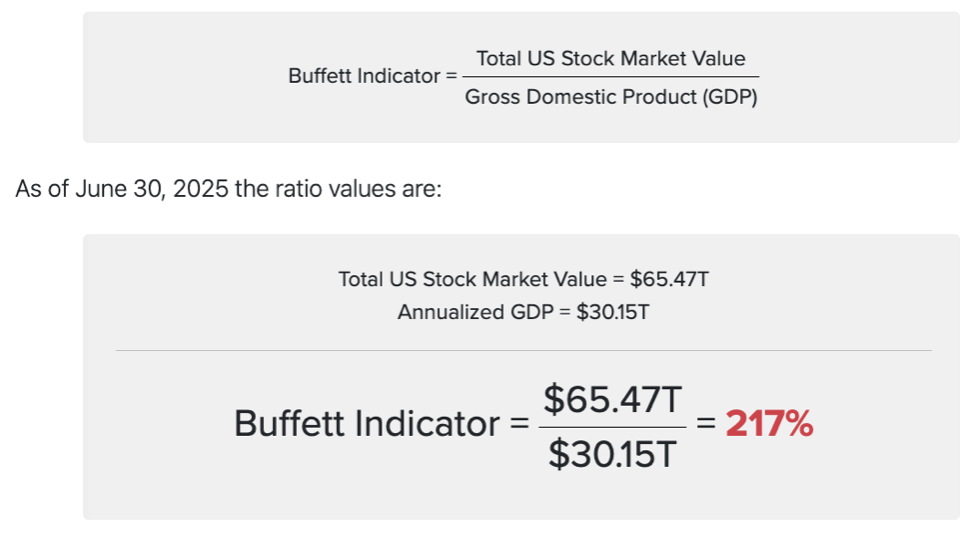
Currrent Shiller PE (see below) is showing overbought conditions as index is far above mean/media
and our AryaFin engine is indicating caution. Have a good weekend.