Weekly Market Commentary - Oct 19th, 2024 - Click Here for Past Commentaries
-
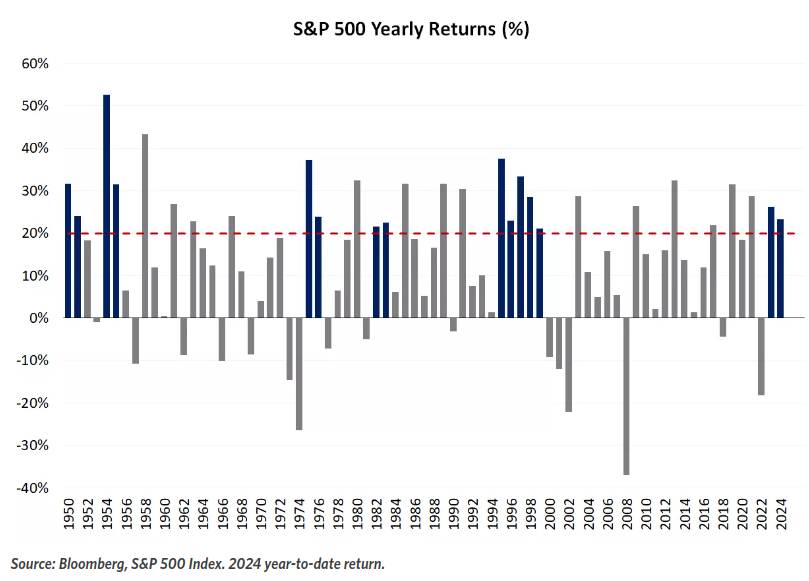
The stock market has been on quite a run, rallying more than 12% just since early-August and
extending its year-to-date return to nearly 23%. If the S&P 500 holds on to this gain for the
remainder of 2024, this will be the second consecutive year with a return of 20% or more.
-
Since 1950, there have been five previous instances in which the stock market followed a
20%-plus annual gain with another 20% year. Two of them came in the 1950s, and as far as the
magnitude of the gains, these were the most impressive periods, with gains of 32% and 24%
in 1950-51, and then 53% and 32% in 1954-55. The next came in 1975-76, then again in 1982-83,
followed by the tech bubble-phase in the late-1990s. Outside of those periods, there were 14
years in which the market gained 20% or more, but failed to repeat that feat. Of those instances,
the market rose the following year nine times and declined five. Of the years with a gain, the
average was 14%. The average loss in those five instances was 8%. So while 20%-plus yearly gains
are common (nearly 40% of years from 1950 to 2023 had a return above 20%), back-to-back rallies
of that magnitude are fairly rare. Thus, the adjoining gains last year and in 2024 (so far)
should not be taken for granted.
-
As the chart above shows, there was just one instance in the last 75 years in which the market
was able to extend the 20% winning streak to a third year. As a good reminder of just how prolific
the bull market of the 1990s was, the run of consecutive 20%-plus gains was extended to five
consecutive years. We'd note that this is also how bubbles are formed. Excluding that run in the
1990s, in the four previous instances in which the market logged back-to-back 20% returns, the
following (third) year saw a gain in three of the four, with an average return of 6%. Looked at
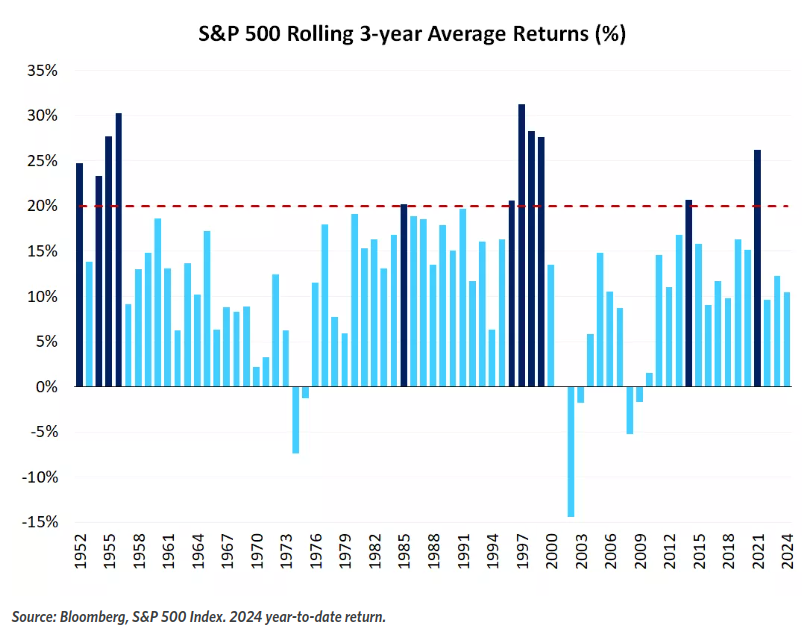
differently, if we focus less on individual calendar years and evaluate rolling three-year-period
returns, we see that there are more instances in which returns averaged more than 20% per year
over a three-year stretch. In addition to the 1990s, this was the case several times in the 1950s,
the mid-1980s, the mid-2010s and again in the early 2020s. We'd also point out that by this measure,
recent market returns are healthy (averaging 11% from 2022-24)
-
The post-war expansion in the 1950s was a powerful force for the markets. The recovery from the
stagflationary downturn fueled the rally in the mid-1970s. The rally in the 1980s occurred after
the end of the inflation-driven double-dip recession, while the mid- to late-1990s gains were
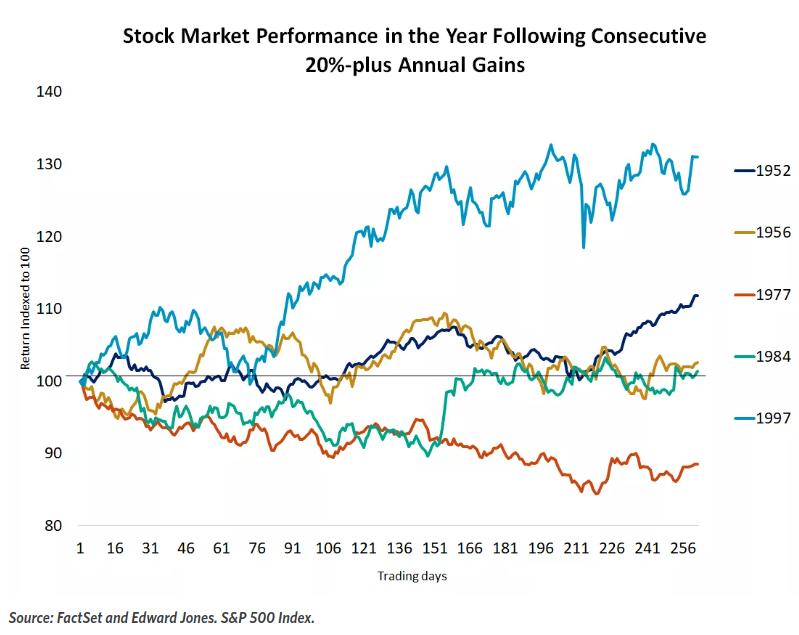
driven by a strengthening economy and the dot-com mania. While far from infallible, we'd point out
that the current setup is supportive of the case for another positive year in 2025. GDP growth
isn't as robust as prior instances, but we don't think a recession is imminent. The Fed is easing
policy now, where it was tightening in most prior instances. Corporate earnings are accelerating
compared with a weakening profit trend in the previous comparable periods.
Nevertheless, stock market is at overbought state and investors must be selective.
-
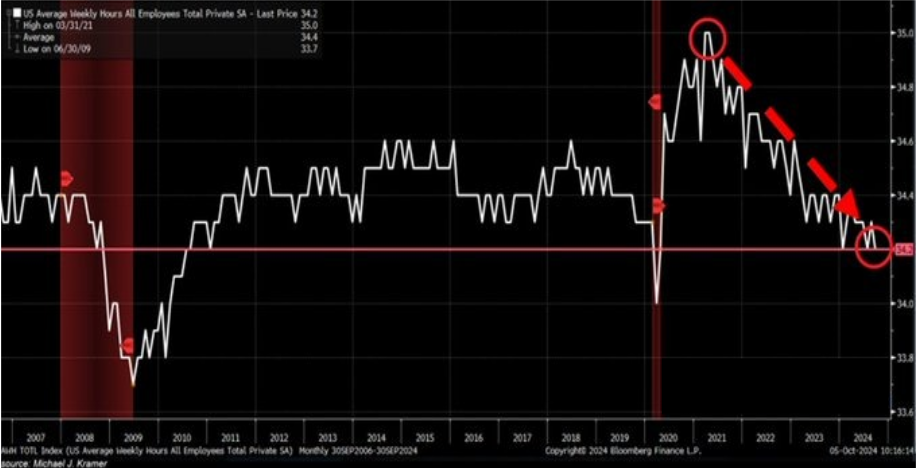
US average weekly hours worked by Americans fell to 34.2 in September, the lowest in 14 years
outside of 2020. Over the last 3 years, average weekly hours have decreased by 0.8 posting the
largest decline in at least 20 years. People are working fewer hours as companies reduce
working time to avoid layoffs and cut costs. At the same time, the number of full-time jobs
has declined for 8 straight months while part-time jobs have skyrocketed, also impacting labor
hours. Last month, the number of part-time vacancies hit 28.16 million, the third largest in
history, and ~400,000 above the 2008 Financial Crisis peak levels.
-
The U.S. budget deficit grew to $1.833 trillion for fiscal 2024, the highest outside of the
COVID era, as interest on the federal debt exceeded $1 trillion for the first time and spending
grew for the Social Security retirement program, health care and the military, the Treasury
Department said on Friday. The deficit for the year ended Sept. 30 was up 8%, or $138 billion,
from the $1.695 trillion recorded in fiscal 2023. It was the third-largest federal deficit in
U.S. history, after the pandemic relief-driven deficits of $3.132 trillion in fiscal 2020 and
$2.772 trillion in fiscal 2021. The fiscal 2023 deficit had been reduced by the reversal of
$330 billion of costs associated with President Joe Biden's student loan program after it was
struck down by the U.S. Supreme Court. It would have topped $2 trillion without this anomaly.
-
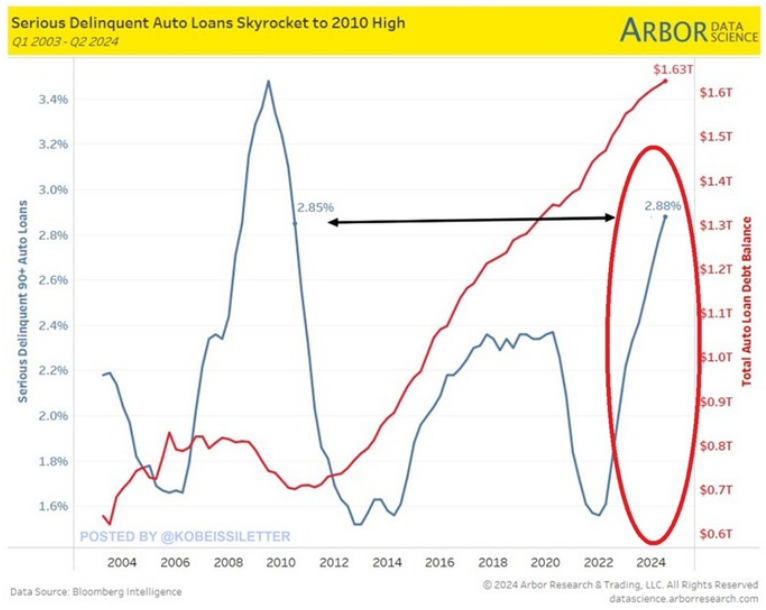
Auto loan 90+ day delinquency rates are now 2.88%, the highest since Q2 2010. The percentage has
almost DOUBLED in just 2.5 years. Serious delinquent auto loans have been rising at the
fastest pace since the 2008 Financial Crisis. At the same time, auto loan debt held by
Americans rose to a record $1.63 trillion, 92% above 2008 levels. Meanwhile, car insurance costs
jumped by 15% in the first half of 2024 and hit a new record of $2,329.
-
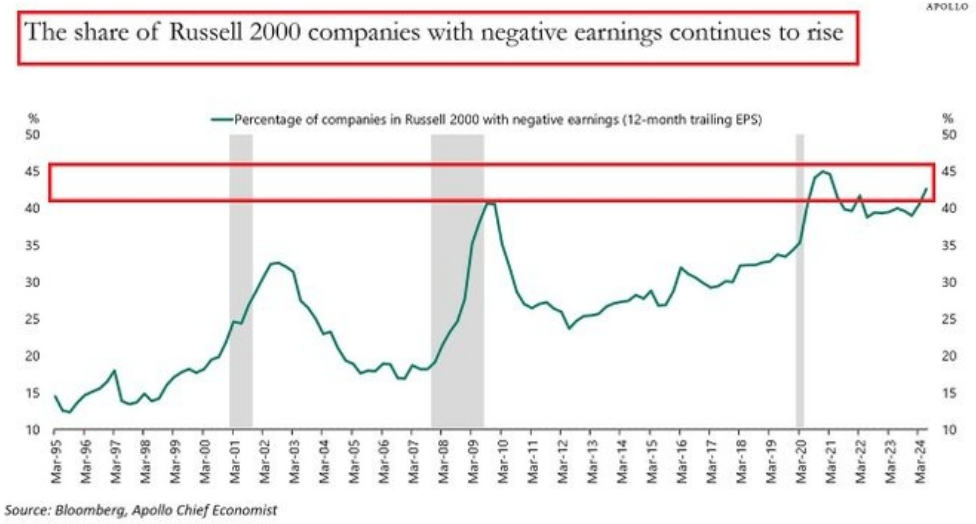
43% of the Russell 2000 companies are unprofitable, the most since the COVID CRISIS.
At the same time, interest expense as a % of total debt of the Russell 2000 firms hit 7.1%,
the highest since 2003.
-
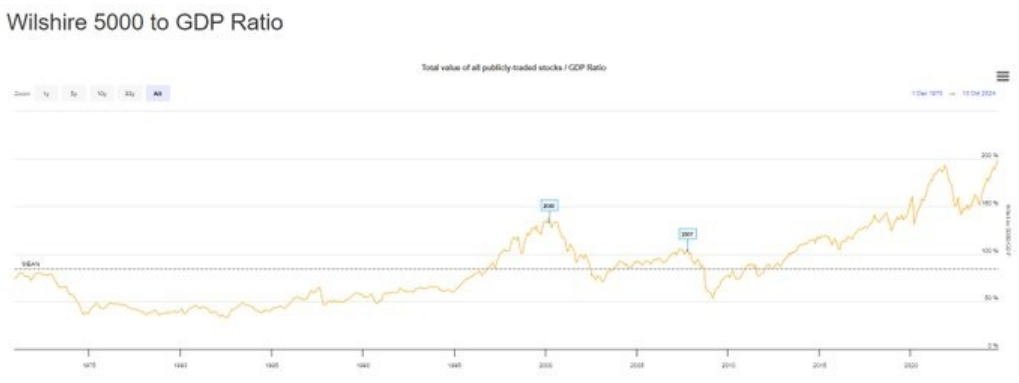
Warren Buffett Indicator hits 199%, the highest level in history, surpassing the Dot Com
Bubble and the Global Financial Crisis
-
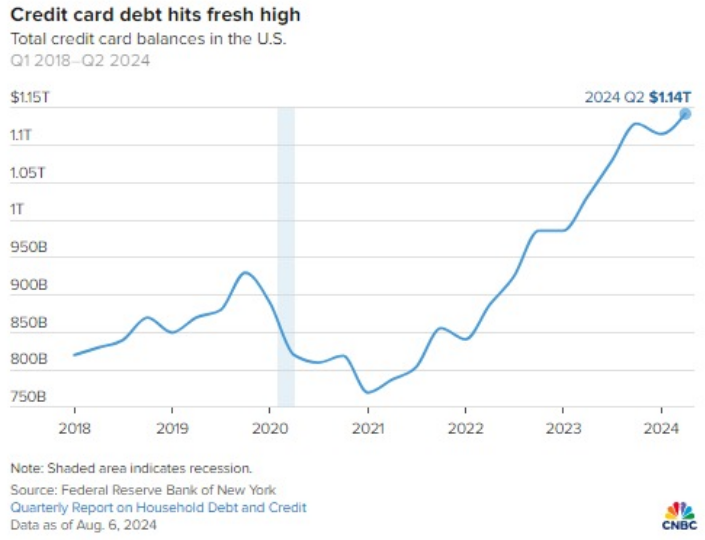
Total Credit Card Debt hits new all-time high of $1.14 Trillion!
-
Final Words: Markets are at the alltime high and fed is cutting
interest rate, caution warranted. Below is CNN Greed vs Fear Index, pointing at
'extreme greed' while global political turmoil is at peak.
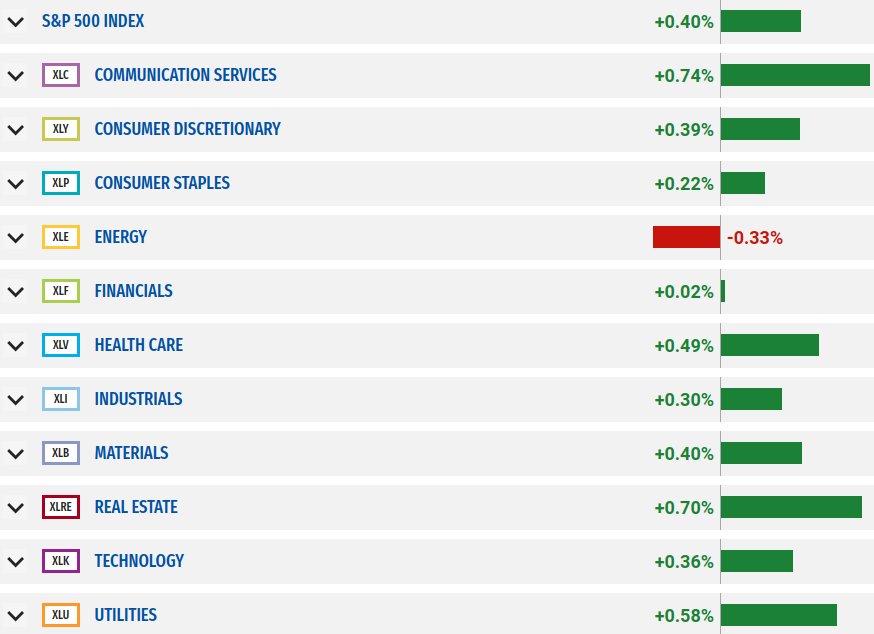
Below is last week sector performance report.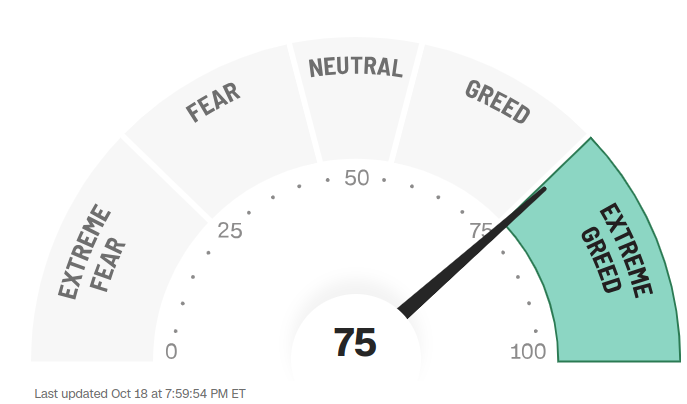
If you are looking for investment opportunities, you can take a look at our
Hidden Gems
section, and if you want to see our past performance, visit our
Past Performance section. If you are looking for
safe and low cost Exchange Traded funds(ETFs), check out our
ETF recommendations.
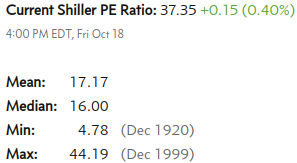
Currrent Shiller PE (see below) is showing overbought conditions as index is far above mean/media
and our AryaFin engine is indicating caution. Have a good weekend.
