Weekly Market Commentary - Nov 30th, 2024 - Click Here for Past Commentaries
-
Elevated inflation has trended downward, allowing multiple major central banks to ease monetary
policies, which are becoming increasingly supportive for economic growth, labor markets and
corporate profits. Last week's U.S. gross domestic product (GDP) growth estimates and personal
consumption expenditure (PCE) inflation data confirmed these overall trends remain intact.
With solid fundamentals in place and momentum’s wind in the market’s sails, well-diversified
portfolios may once again leave us feeling grateful in 2025, but the ride will undoubtedly be
different. Stay prepared with properly balanced portfolio allocations, a disciplined
rebalancing strategy and appropriate performance expectations.
Relative economic resiliency and the growth prospects from tech innovations have helped U.S.
equity markets hold the lead, with all three asset classes soaring over 30% higher in the
past 12 months. And while international equities have lagged amid global trade policy
uncertainty, softer economic prospects and a strengthening dollar, they have produced
still-solid double-digit returns over the same period.
Notably, bonds have made progress climbing back from the challenging rising interest-rate
environment that weighed on their returns in recent years. While their return remains
negative over a 3-year horizon, investment-grade bonds have outperformed cash-like
investments over the last 12 months, despite the post-election uptick in yields recently.
Lower-quality bonds, however, have led the way within fixed income, given their higher
interest rates and contained credit spreads – highlighting the value of diversification.
-
Markets had their bumps in 2024: Inflation-related anxiety was on display in April.
Signs of labor market weakness and growth concerns within tech stocks were among the
suspects during the early August and early September market weakness. And not surprisingly,
October brought the typical pre-election uptick in volatility.
However, these examples were relatively short and mild in nature. Overall, market
volatility in 2024 has been largely subdued. In fact, multiple asset classes have
hit numerous all-time highs during the year.
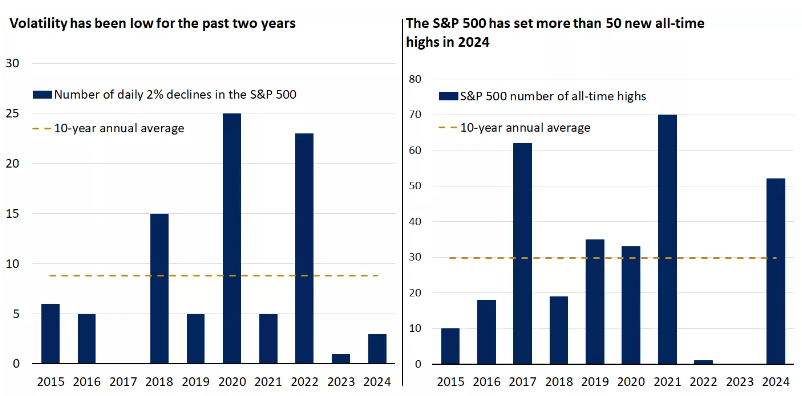
The Russell 2000 Index rose to an all-time high last Monday for the first time since 2021,
while the S&P 500 has set more than 50 new all-time highs this year.* Additionally, the
S&P 500 has seen only 3 daily declines of 2% or more, well below the 10-year average of
nearly 9 per year.
-
With solid fundamentals in place and momentum’s wind in the market’s sails, well-diversified
portfolios may once again leave us feeling grateful for further gains in 2025. However, the
ride will undoubtedly be different. We anticipate a return to more normal levels of volatility,
given the attention markets have placed on shifting global policies and their potential impact
on inflation and economic growth.
Appropriate long-term performance expectations can help you stay patient when bouts of
volatility occur. This is particularly true when your portfolio’s mix between stocks and
bonds is aligned with your investment strategy.
And when these short-term pullbacks happen — which they will — view them opportunistically
by adding quality investments at lower prices, with a focus on diversification.
-
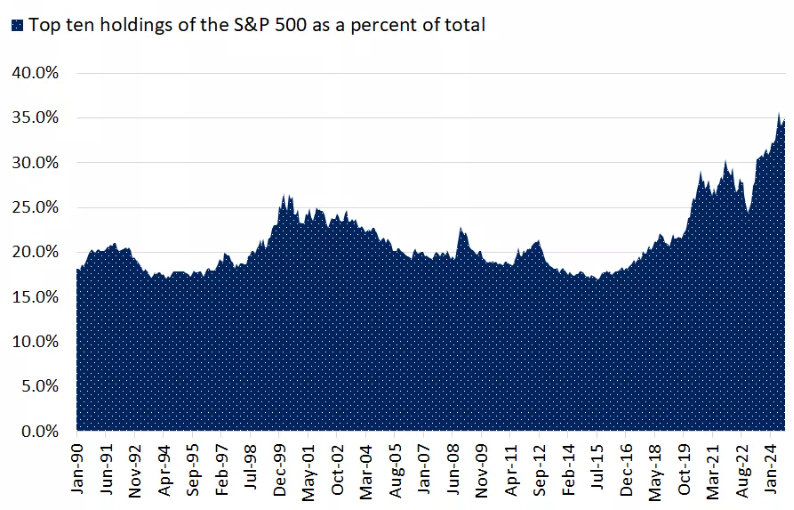
Outperformance from U.S. stocks over the course of 2023 and into 2024 is owed in large
part to the meaningful gains from a small number of tech-oriented mega-cap stocks. Their
heavy weight translates into an outsized impact on the returns of popular indexes such as
the S&P 500, particularly now that their recent success has resulted in historic index
concentration. The top 10 companies in the S&P 500 now represent nearly 35% of the index.
More recently, however, market leadership has broadened beyond this narrow set of U.S.
large-cap stocks, creating a healthier backdrop for the bull market’s momentum to continue.
Following the recent rally, the financials sector has returned over 50% in 12 months,
officially outpacing formerly leading technology, consumer discretionary and communications
services. Industrials and utilities have also played catch-up, both rising over 30% over the
same period.
Not only have a wider range of sectors produced meaningful gains, but asset class leadership
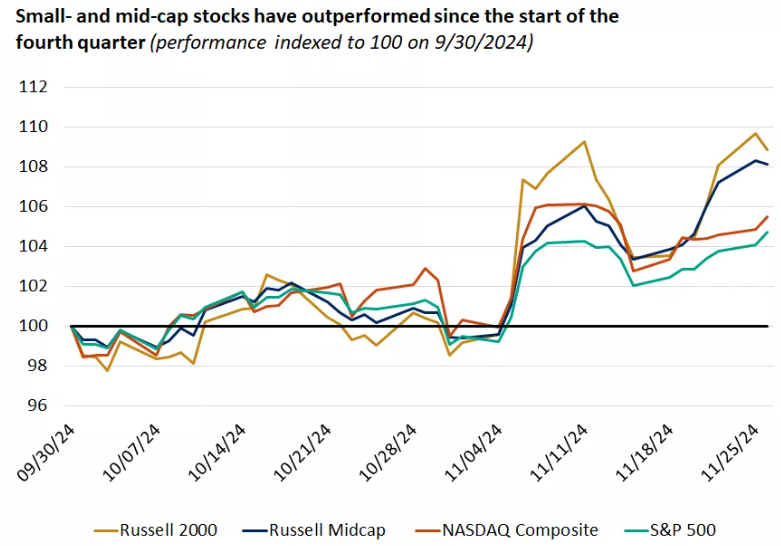
has also shown signs of rotation. More broadly, U.S. small- and mid-cap stocks have led markets
over a 12-month time frame, helped by their outperformance since the start of the fourth quarter.
The post-election rally in these more economically sensitive asset classes has benefited portfolios
with overweight allocations.
-
No single asset class index — particularly those that are historically concentrated — represents
the risk and return objectives of a well-diversified portfolio. Therefore, none should be the
sole benchmark for a portfolio’s design or performance.
While we’d acknowledge there are reasons for optimism in the largest companies in the S&P 500,
2024 has proved investment opportunities exist outside these growth-style stocks. We recommend
investors maintain balance in their portfolios, incorporating allocations to a variety of asset
classes with exposure to multiple sectors and regions based on their long-term goals.
-
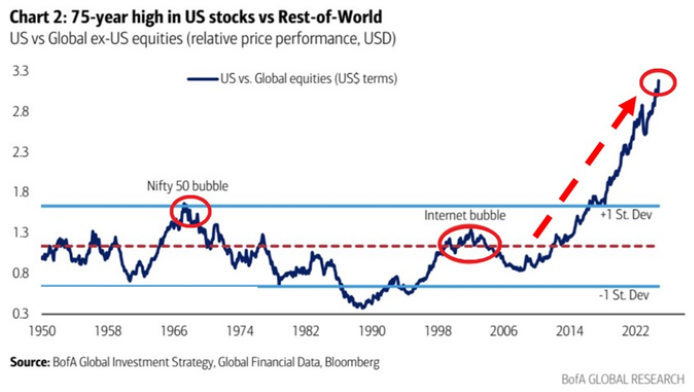
Currently, the US to global equity ratio stands at an all-time high of 3.2x.
The ratio has DOUBLED in just 8 years as US stock market returns have significantly outperformed
global benchmarks.
To put this into a perspective, the long-term average since the 1950s has been ~1.1x.
Since 2008, US equities have outperformed global stocks by a whopping 400%.
Such relative superior returns have never been seen in history.
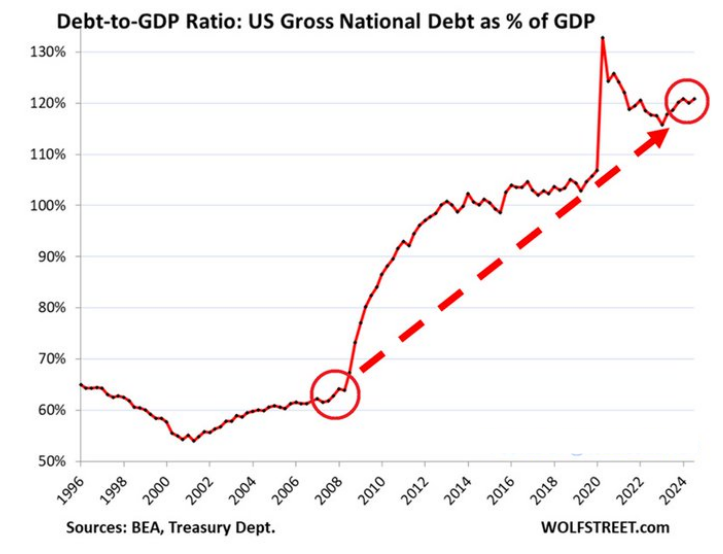
Meanwhile, total US debt is now up ~$13 TRILLION since 2020 and at a record $36 TRILLION.
The US is projected to spend $3.8 billion PER DAY on interest expense in 2025.
-
The US Debt-to-GDP ratio just hit 121%, the highest since 2021 and up from ~60% in 2008.
Not even World War 2 saw US Debt-to-GDP rise above 120%.
Since 2008, total Federal debt is now up roughly $27 TRILLION.
Never in history has the US government borrowed like this.
-
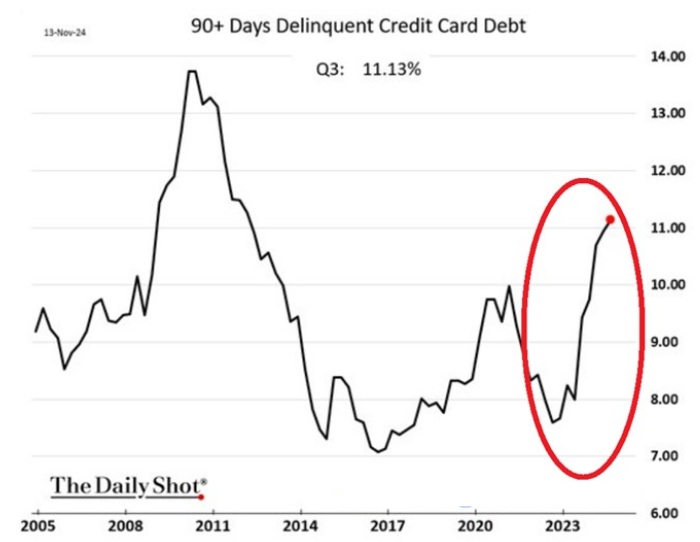
11.1% of US credit card debt was delinquent for 90+ days in Q3 2024, the highest amount since 2011.
-
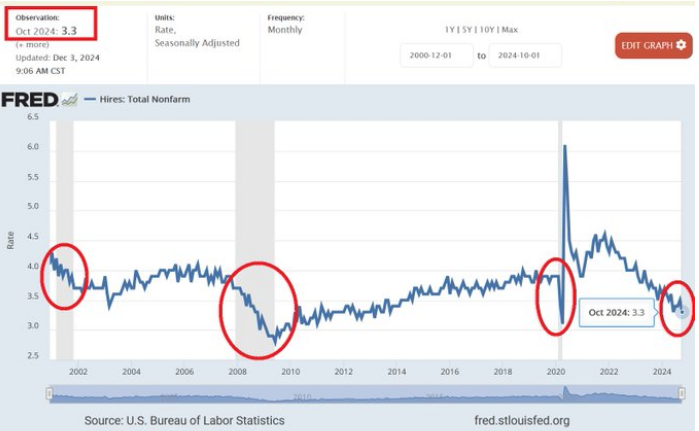
US hires as % of employment has dropped to 3.3%, THE LOWEST since the 2020 Pandemic CRISIS.
The hiring rate is now below the 2015-2019 pre-pandemic average of 3.8% and below the 2001 recession levels.
Hiring has been falling for 3 years.
-
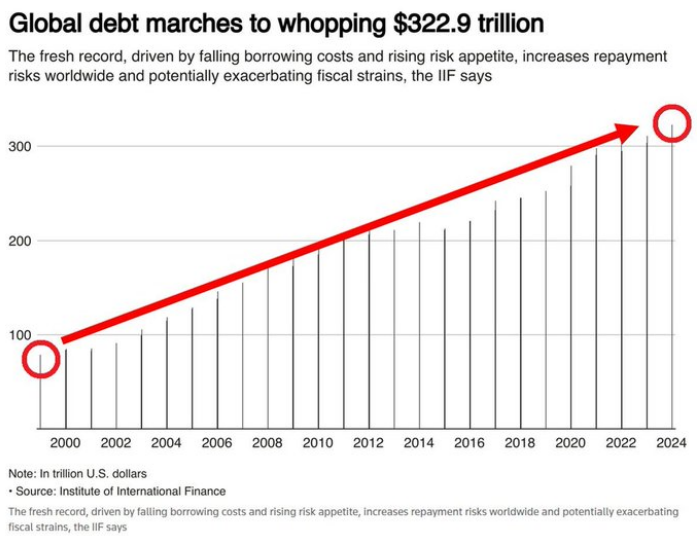
Global debt rose by over $12 trillion in Q1-Q3 and hit a MASSIVE $322.9 trillion, a new all-time high.
Over the last 2 decades, world's debt has TRIPLED.
Debt is more than 3 TIMES larger than the global economy.
-
Final Words: Markets are at the alltime high and fed is cutting
interest rate, caution warranted. Below is CNN Greed vs Fear Index, pointing at
'greed' while global political turmoil is at peak.
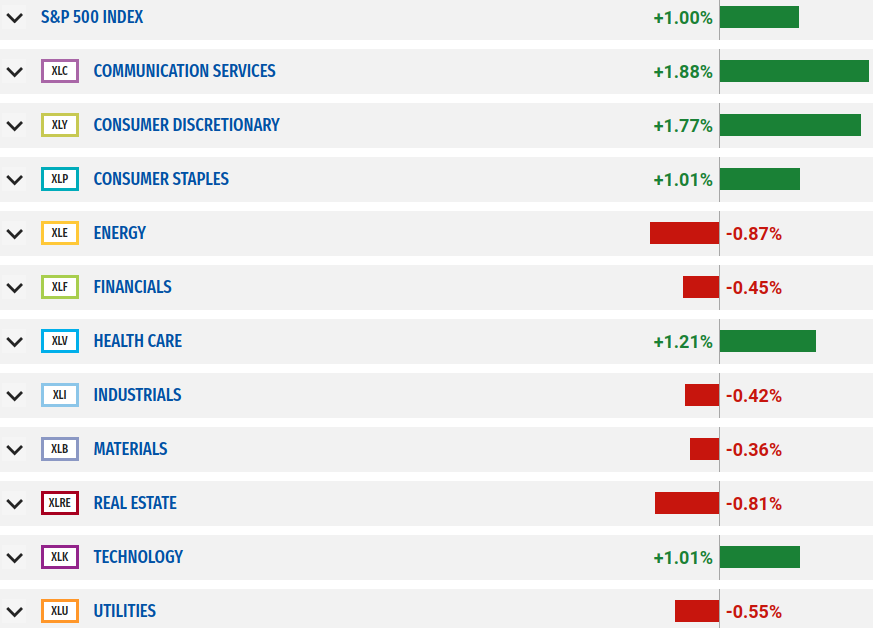
Below is last week sector performance report.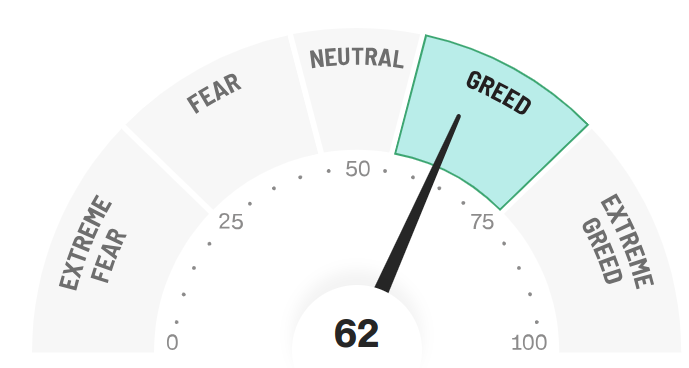
If you are looking for investment opportunities, you can take a look at our
Hidden Gems
section, and if you want to see our past performance, visit our
Past Performance section. If you are looking for
safe and low cost Exchange Traded funds(ETFs), check out our
ETF recommendations.
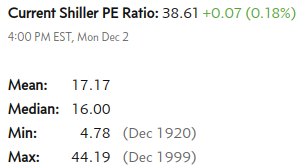
Currrent Shiller PE (see below) is showing overbought conditions as index is far above mean/media
and our AryaFin engine is indicating caution. Have a good weekend.
