Weekly Market Commentary - Nov 22, 2025 - Click Here for Past Commentaries
-
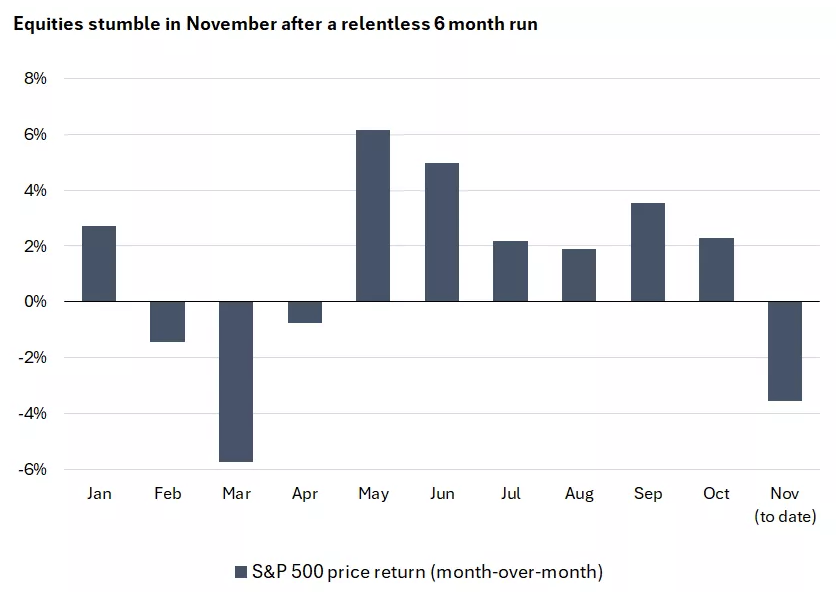
Global markets experienced renewed volatility last week, with equities ending lower amid choppy trading and extending
the worst stretch since April’s tariff-driven sell-off. Weakness stemmed partly from technology sector concerns, as even
strong NVIDIA earnings failed to halt the correction, with investors taking profits amid ongoing bubble fears. Uncertainty
over the Fed’s next steps offers little clarity, as shutdown-related data disruptions cloud the economic picture. In our
view, a correction in this buoyant market was overdue, and investors should not overreact to November’s setback. That said,
recent moves underscore the value of diversification today. Lower entry points may present opportunities, especially as real
returns on cash and bonds continue to shrink.
-
We can point to a couple of plot twists driving this upheaval. First, the boom in AI stocks, which had helped power
large-cap equity-market gains, is looking vulnerable, with investors booking profits as concerns grow over valuations
and a potential bubble. Second, there is increasing uncertainty that the Fed will swoop in with rate cuts to help soothe
markets.
To stretch our analogy perhaps uncomfortably far, we don't think this is the end of the show. Spikes in volatility are normal in equity markets and, we think, even less surprising given the speed and scale of recent gains. A reset in expectations might be a healthy dynamic, in our view, and present an opportunity for investors to put cash to work and diversify portfolios.
-
The so-called Magnificent Seven mega-cap tech companies have had a tough month. In market-capitalization-weighted terms,
this group is down nearly 6% in November so far, dragging large-cap markets—and particularly the tech-focused Nasdaq
index—lower.
We wrote in last week’s wrap that the market looked ripe for profit-taking after an extraordinary run, especially as concerns grew about froth in the tech sector. Further evidence of these dynamics emerged this week around NVIDIA’s highly anticipated third-quarter earnings.
At first glance, the results were strong: third-quarter sales beat expectations, current-quarter guidance was raised, and management signaled potential to exceed the projected $500 billion revenue uplift in 2026.
Yet after an initial rally in NVIDIA stock drove a 1% bounce in the S&P 500, sentiment reversed sharply, pushing markets lower. Since 1957, an opening rally of this magnitude has closed in the red only eight times.
There might be a couple of factors driving this disappointment:
First, while sales-growth projections remain strong, they are expected to slow in coming years, potentially ending the run of exponential-feeling growth in the sector; and
Second, despite NVIDIA CEO Huang's attempts to push back on the AI-bubble narrative, the market is increasingly uneasy about the sustainability of current investment rates and their long-term payoff.
We flagged last week that certain tech companies are starting to build leverage to finance AI investment and shifting to more asset-heavy business models, posing risks to margins and free cash flow. On this theme, we saw a further rise in Oracle’s CDS spread – a measure of creditworthiness – this week, a potential gauge of these worries.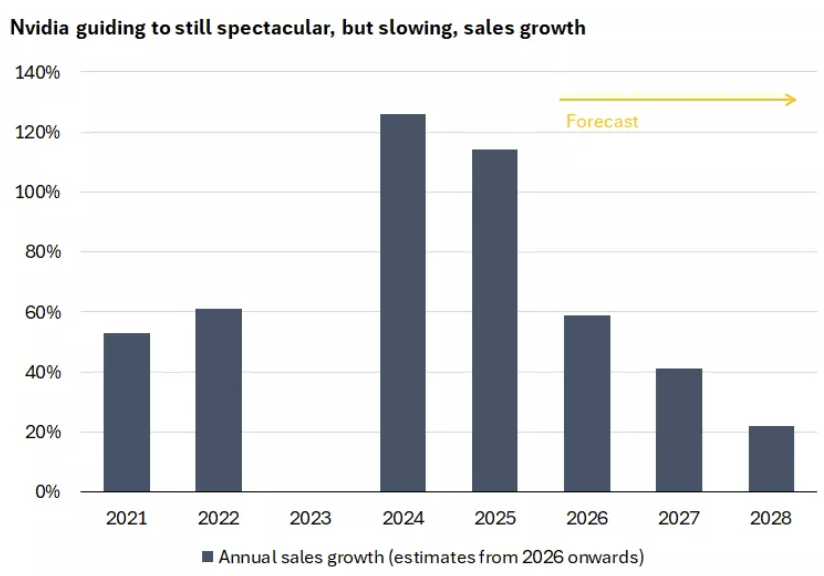
Despite these changes – and what looks like broader uncertainty around the long-term payoff from AI investments – we don’t think investors should overreact to the wobble in short-term sentiment around the sector. Mega-cap stocks have consistently delivered strong earnings growth, the near-term investment outlook remains robust, and valuations, while elevated, do not look stretched to extremes as seen in the lead-up to previous bubbles. However, we think further sentiment- or valuation-driven setbacks remain possible, despite these still strong-looking fundamentals.
-
Alongside booming AI stocks, one of the themes driving the market higher in 2025 has been the resumption of Federal Reserve
interest-rate cuts. However, after two consecutive cuts in September and October, there is considerable uncertainty about the
Fed's next move in early December.
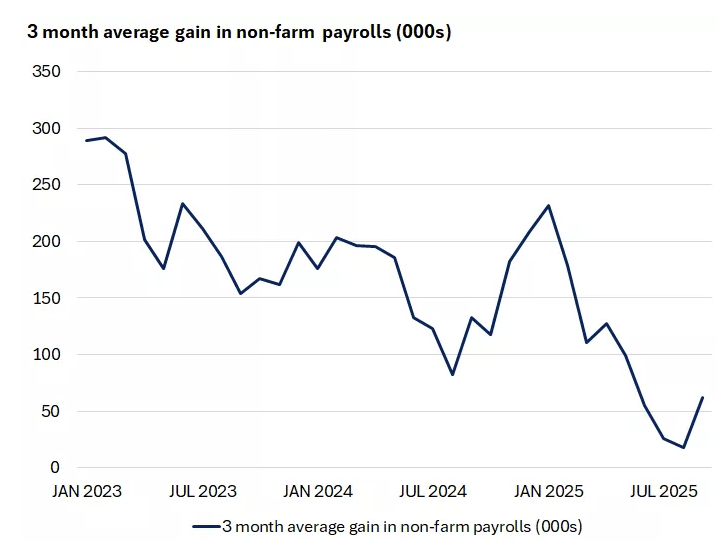
This ambiguity partly stems from the recent record-breaking government shutdown, which disrupted economic data collection and release. The September payrolls report finally arrived last week but raised more questions than answers.
On the positive side, hiring through September exceeded expectations, with payrolls up 119,000 amid broader sectoral improvements. However, prior months saw familiar downward revisions, and the unemployment rate continues to drift concerningly higher.
-
This is the last official labor-market data the central bank will receive before deciding interest rates on December 10.
The October and November reports will be delayed until December 16, with only part of the October edition published due to
missed data collection. Similarly, the Fed will not receive an October CPI report, with the November reading also due after
its December meeting. For a central bank targeting inflation and employment, this shortfall is far from ideal.
The minutes from the October meeting show clear Fed concerns about these disruptions: "various participants expressed concern about…the ability to accurately assess economic conditions because of limitations to the availability of federal government data. "Additionally, following two consecutive rate cuts and with inflation at 3%, well above the Fed's 2% target, more hawkish committee members appear uneasy with further easing: "Most participants noted that, against a backdrop of elevated inflation readings and a very gradual cooling of labor market conditions, further policy rate reductions could add to the risk of higher inflation becoming entrenched."
Against this backdrop, market expectations for a December cut have fluctuated sharply. In late October, a cut was nearly fully priced at close to 100% probability of a 25 basis point move. Odds later fell to 30% early last week before rebounding to 70% on Friday following dovish comments from New York Fed President Williams.
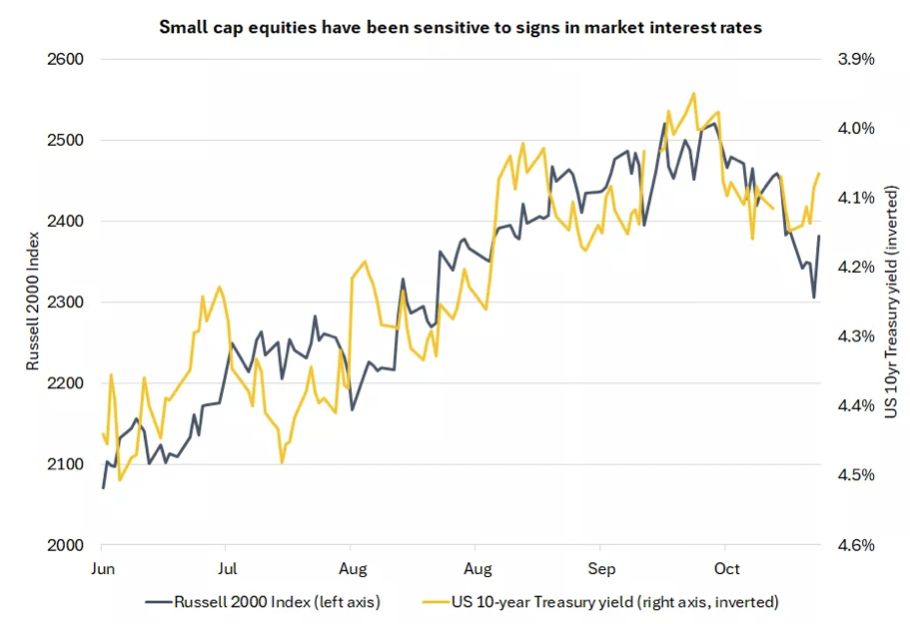
We think the decision will be finely balanced, with numerous dissents likely whether the Fed cuts or holds. Looking further ahead, we remain confident that the fed funds rate path is lower as the Fed reverses its post-pandemic tightening, supporting U.S. growth and corporate earnings, especially in interest-rate-sensitive small caps. However, given solid growth and potentially persistent inflation, we view market expectations for rates to bottom around 3% next year as overly optimistic and instead see the fed funds rate falling to 3%–3.5%.
This gap between our forecast and market pricing could pose a risk to small-cap equities. That said, if the Fed cuts less due to a solid or improving economic backdrop, those dynamics might offset higher interest-rate costs for the sector.
-
An outbreak of volatility following a period of calm can feel unsettling. Movie directors use these sudden shifts to keep
viewers on the edge of their seats.
However, we shouldn't be shocked into making drastic changes to portfolios following the recent market reassessment. Instead, these dynamics provide useful reminders of the value of diversification.
The AI-led sell-off over recent weeks has sparked rotation toward unloved sectors, like health care and materials/energy. We believe these companies could offer further catch-up growth potential if AI selling continues, especially given their lower valuations.
-
Final Words: Market indicates extreme fear. Buy VOO, VGT, and GLD (Gold).
Below is last week sector performance report.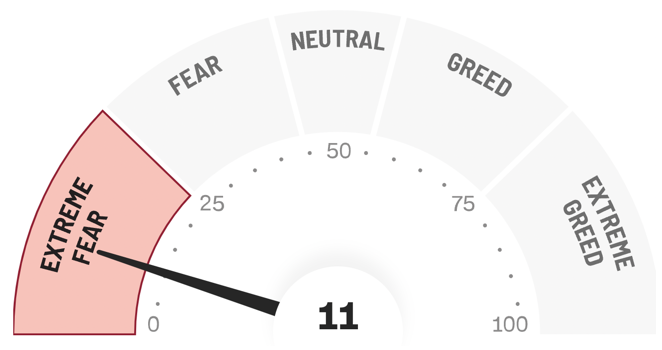
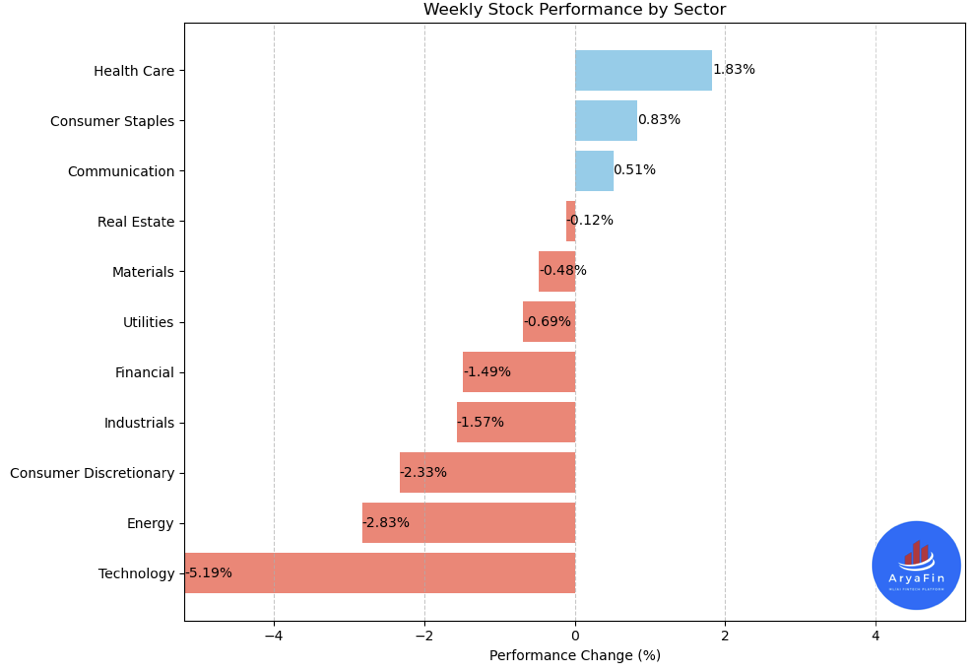
Weekly Sector Performance for Nov 17-21, 2025:
$XLE Energy: -2.83%, RSI: 51.07
$XLK Technology: -5.19%, RSI: 35.61
$XLC Communication: 0.51%, RSI: 44.33
$XLY Consumer Discretionary: -2.33%, RSI: 39.04
$XLP Consumer Staples: 0.83%, RSI: 53.97
$XLF Financial: -1.49%, RSI: 42.68
$XLV Health Care: 1.83%, RSI: 75.90
$XLI Industrials: -1.57%, RSI: 40.33
$XLB Materials: -0.48%, RSI: 47.48
$XLRE Real Estate: -0.12%, RSI: 46.29
$XLU Utilities: -0.69%, RSI: 41.94
If you are looking for investment opportunities, you can take a look at our
Hidden Gems
section, and if you want to see our past performance, visit our
Past Performance section. If you are looking for
safe and low cost Exchange Traded funds(ETFs), check out our
ETF recommendations.
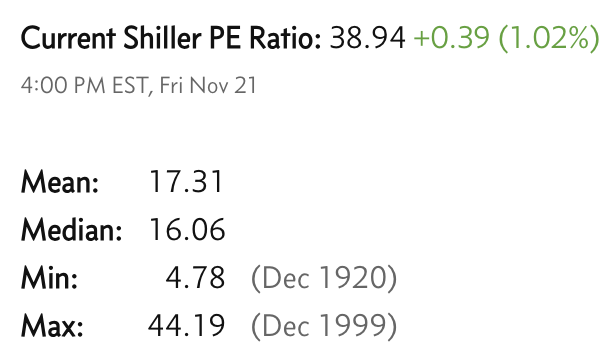
Currrent Shiller PE (see below) is showing overbought conditions as index is far above mean/media
and our AryaFin engine is indicating caution. Have a good weekend.