Weekly Market Commentary - Nov 15, 2025 - Click Here for Past Commentaries
-
The 43-day U.S. shutdown concluded with the passage of a funding bill that extends operations through
January 30, 2026. Federal workers will receive back pay, and critical programs, such as SNAP, are restored.
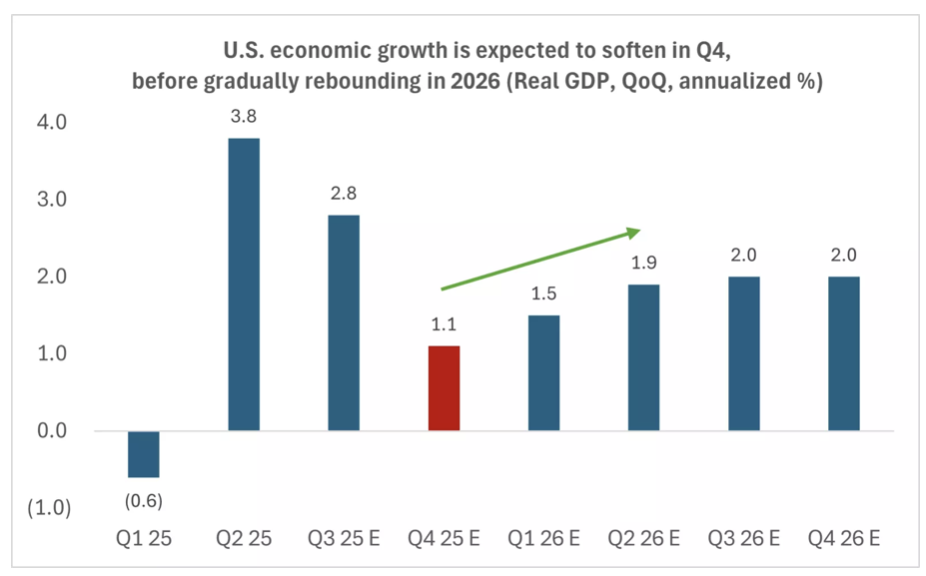
The shutdown is estimated to reduce fourth-quarter 2025 economic growth by 1.5 percentage points, lowering
projections to 1.0% to 1.5%. Nonetheless, we expect a gradual recovery in the first quarter and through 2026.
The technology and AI sectors are underperforming in November after a strong rally since April. Mega-cap tech
companies are facing challenges from rising debt levels and a shift toward asset-heavy business models, which
could impact their margins and free cash flow. Diversification is crucial in this backdrop, and we see
opportunities in U.S. large-cap and mid-cap stocks, as well as the healthcare and industrials sectors, and
emerging-market equities to balance our technology exposure.
-
What are the key implications of U.S. government shutdown end?
First, the end of the shutdown means that the roughly 1.4 million federal workers who have gone without pay, about half of whom were furloughed, are eligible for backpay. Most of these paychecks should be distributed by Wednesday, November 19. The Congressional bill to end the shutdown also reverses the layoffs of the more than 4,000 federal workers who lost their jobs at agencies including the Department of Commerce, Education, and Homeland Security. The bill also prevents any more layoffs until at least the end of January.
Second, the Congressional bill mandated the restarting of critical federal programs. This includes the restoration of programs like SNAP (Supplemental Nutrition Assistance Program), which is funded through September 2026, although the full resumption of payments may vary by state. Similarly, airlines will likely ramp back up to their full capacity in the coming days, after air traffic had been reduced at 40 of the country's busiest airports last week. Airlines should be back at capacity ahead of the U.S. Thanksgiving holiday.
In addition, U.S. economic data that was halted during the shutdown could resume in the weeks ahead, albeit some data may be murky still. For example, the U.S. nonfarm-jobs report for October is expected to be released next week, and while it will include total jobs added, the report will not include the unemployment rate, as the household survey was not completed.* The BLS (Bureau of Labor Statistics) is expected to release a full schedule of its economic data releases in the days ahead, which should include dates for critical inflation and labor-market data.
Finally, while Congress was able to pass a funding bill through the end of January, the question around health care premiums remains outstanding. The Affordable Care Act (ACA) health care premiums are expected to rise after December 31, 2025, as subsidies expire for most of the 24 million people enrolled in the marketplace.* As part of the U.S. government reopening, the Senate will schedule a vote by mid-December to extend the ACA subsidies for three years, although there is no guarantee of this passing in both the Senate and the House. If no deal is reached, health care costs will likely increase, and the chances of a repeat shutdown after January next year likely rise once again.
Overall, while it was positive that the U.S. government resumed operations last week, the shutdown will likely cause some damage to fourth-quarter economic growth. The Congressional Budget Office (CBO) estimated that the shutdown could reduce U.S. real GDP growth by about 1.5 percentage points in the fourth quarter of 2025. Before the shutdown, Bloomberg estimates indicated that the U.S. economy was on pace to grow around 2.5% to 3.0%, which is likely to come down to the 1.0% to 1.5% range. However, we expect a recovery in the first quarter of next year, albeit perhaps a slower rebound as operations gradually resume and federal workers receive back pay. Nevertheless, many households may face higher healthcare costs.
-
In our view, after a nearly 55% rally in the Nasdaq since the April 8 lows,* the technology sector may have
been due for a period of consolidation or some profit-taking. We believe this is especially true as we head
into year-end and investors consider rebalancing their portfolios and positioning for 2026.
In addition to elevated expectations and some extended valuations, the mega-cap technology companies appear to have also undergone notable shifts in their operating models:
Shifting capital structures: Mega-cap technology companies have historically been cash-rich but are now beginning to issue more debt to finance AI-related capital expenditures.* We think this trend is particularly worrisome in a more debt-burdened company like Oracle, but we are also seeing rising debt levels in companies like Meta and Google.
Shifting business models: The mega-cap tech companies have also transitioned from being notoriously asset-light to more asset-heavy, as investments in data centers and AI infrastructure are expected to reach upwards of $500 billion next year.* Over time, this may weigh on the margins and free cash flows of these companies.
Overall, these shifting trends in the mega-cap technology space are worth monitoring. However, we continue to see the underlying fundamentals of the AI story remain intact. These companies have delivered on both earnings growth and guidance, and continue to reiterate optimism regarding capital-expenditure spending plans. Nonetheless, expectations and valuations were elevated heading into earnings season, and after a powerful rally since April, we believe a reset for this sector could be healthy.
Historically, the factors that end a bull market tend to be a Fed that raises rates aggressively (as was the case in the dot-com boom of the late 1990s) or an economy that is entering a recession. We don't see either of these on the horizon, for now, which gives us some comfort that a pullback may not turn into something more deep or prolonged.
If your portfolio has become too heavily skewed toward equities or technology sectors following a three-year bull market, we recommend considering a portfolio rebalancing to align with your intended allocations. And if you are putting new money to work, we would favor parts of the market that we think have scope for some catch-up and valuation expansion. We recommend both U.S. large-cap and mid-cap stocks, as well as sectors such as healthcare and industrials, and emerging-market equities, to complement your technology and AI exposure.
-
Final Words: Market indicates extreme fear. Buy VOO, VGT, and GLD (Gold).
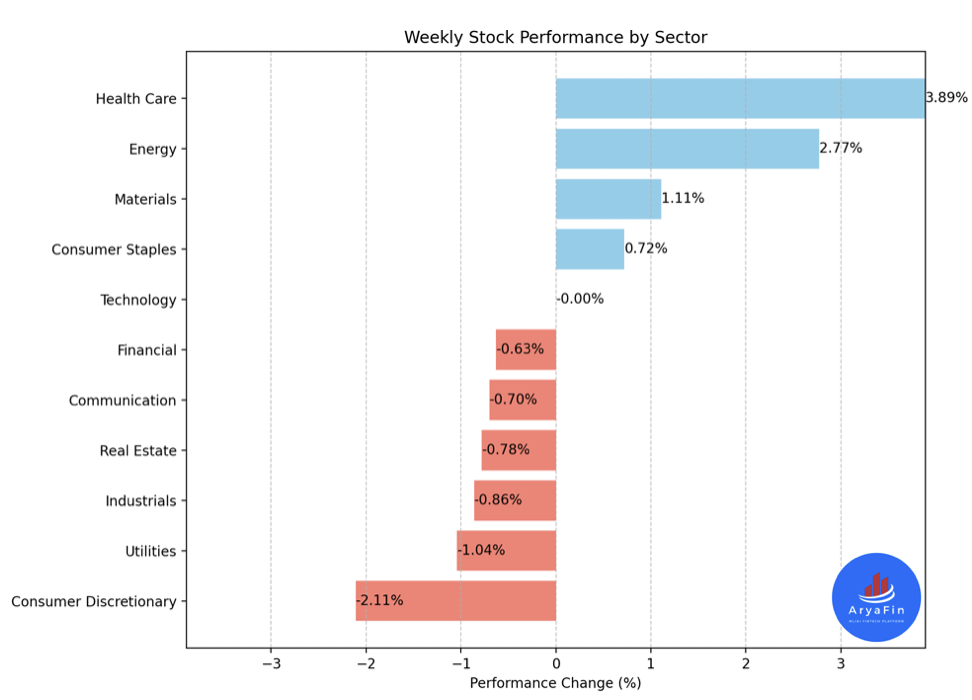
Below is last week sector performance report.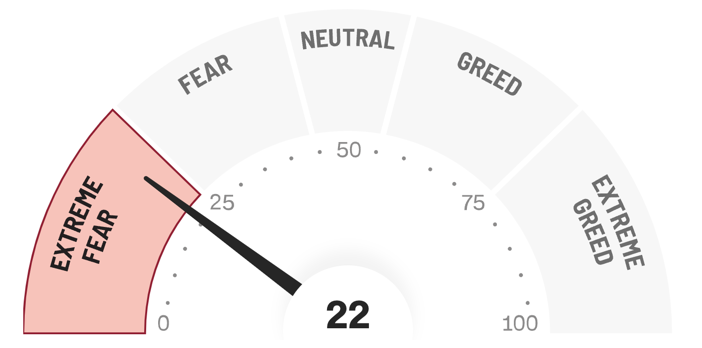
Weekly Sector Performance for Nov 10-14, 2025:
$XLE Energy: 2.77%, RSI: 64.79
$XLK Technology: -0.00%, RSI: 47.35
$XLC Communication: -0.70%, RSI: 37.45
$XLY Consumer Discretionary: -2.11%, RSI: 41.09
$XLP Consumer Staples: 0.72%, RSI: 47.21
$XLF Financial: -0.63%, RSI: 45.75
$XLV Health Care: 3.89%, RSI: 75.25
$XLI Industrials: -0.86%, RSI: 43.60
$XLB Materials: 1.11%, RSI: 46.09
$XLRE Real Estate: -0.78%, RSI: 43.79
$XLU Utilities: -1.04%, RSI: 45.02
If you are looking for investment opportunities, you can take a look at our
Hidden Gems
section, and if you want to see our past performance, visit our
Past Performance section. If you are looking for
safe and low cost Exchange Traded funds(ETFs), check out our
ETF recommendations.
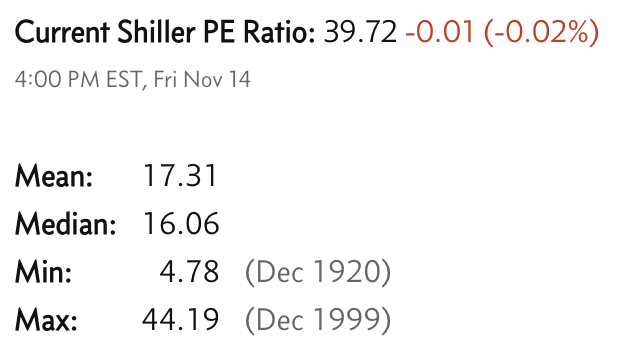
Currrent Shiller PE (see below) is showing overbought conditions as index is far above mean/media
and our AryaFin engine is indicating caution. Have a good weekend.