Weekly Market Commentary - July 12th, 2025 - Click Here for Past Commentaries
-
Stocks held near record highs set this week, aided by strong performance in the energy
and industrial sectors that helped offset the risk-off sentiment driven by tariff headlines.
New tariffs were announced this week on more than 20 countries, with the 90-day pause
extended to August 1.
The One Big Beautiful Bill Act was passed into law on July 4, extending provisions of the
2017 Tax Cuts and Jobs Act and introducing new tax breaks and spending cuts.
-
On July 4, the One Big Beautiful Bill Act (OBBBA) was signed into law, extending several
provisions of the 2017 Tax Cuts and Jobs Act (TCJA). The legislation also provides tax deductions
for tips, overtime pay and social security, subject to limits. The maximum allowable deduction for
state and local taxes — known as "SALT" — rises to $40,000, phasing out at incomes of $500,000
or more
Tax cuts will be costly for the federal government, projected to reduce revenues by $4.5 trillion over the next decade1. Spending cuts, such as work requirements and eligibility changes for Medicaid and nutrition assistance (food stamps) and the termination of renewable-energy credit programs, total about $1.2 trillion. As a result, government deficits are estimated to rise $3.3 trillion over the next decade, shown in the chart below.
Much of the fiscal impact of OBBBA is through extending current tax rates, which limits incremental economic benefits. In addition, much of the tax relief accrues to higher-income households, which are less likely to spend any savings, further reducing stimulative effects. However, certain provisions, such as the reinstatement of 100% bonus depreciation for "qualified property" (which stepped down to 40% in 2025) should help provide a boost for corporations and small businesses, in our view. In combination with deregulation, we believe tailwinds should support a reacceleration of growth in 2026 and 2027.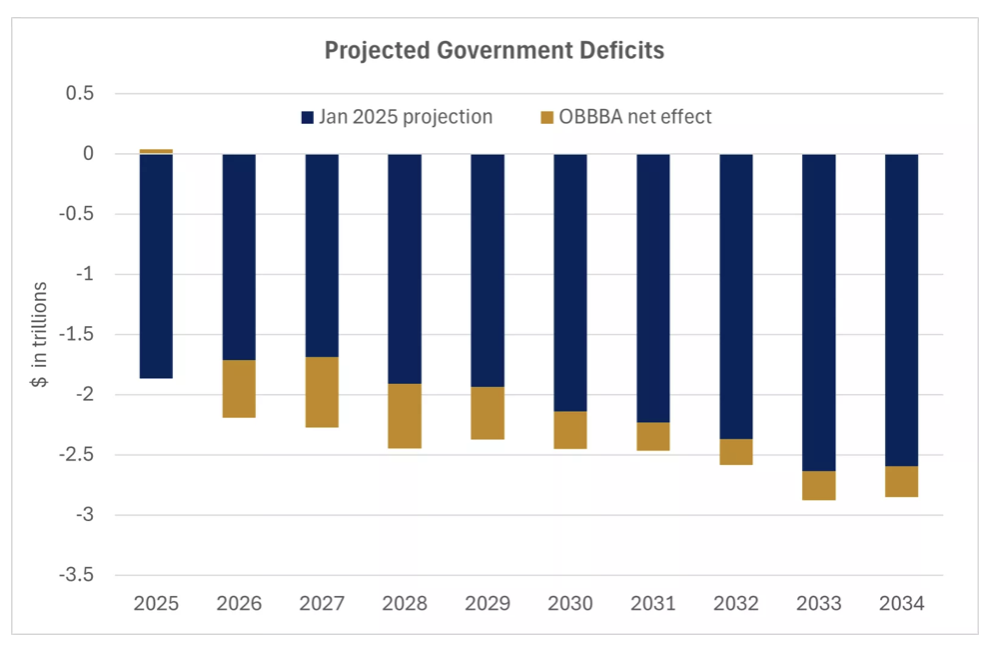
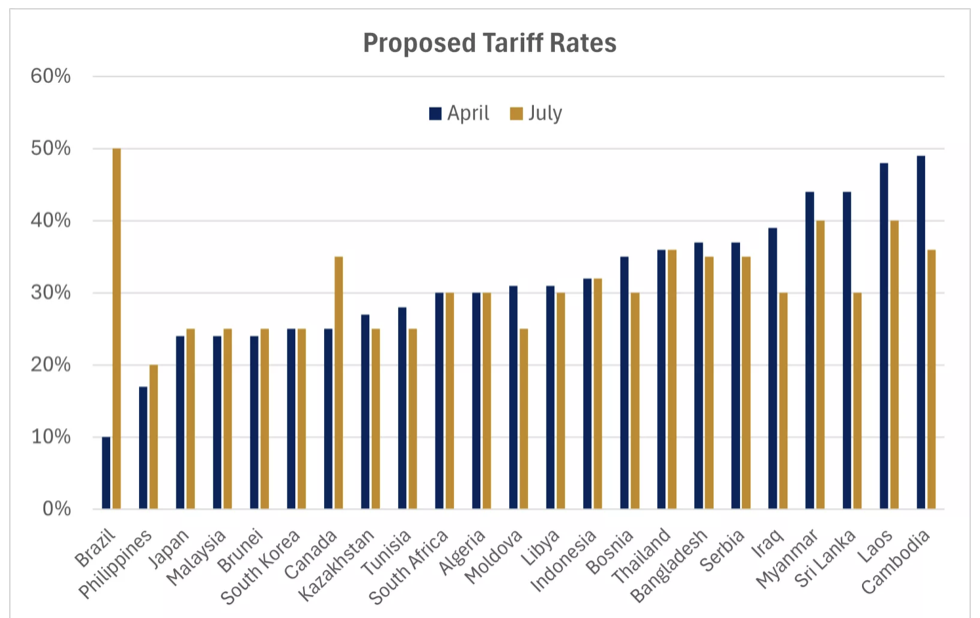
With the 90-day tariff pause expiring on July 9, President Trump announced new tariffs on more than 20 countries this week. Tariff rates vary widely — from 20%-50% — to be applied on August 1 unless countries reach trade deals sooner. The new levies are comparable, on average, to those announced on April 2. Some are higher, while others are lower, perhaps signaling flexibility in some cases. A notable outlier is Brazil, for which tariffs are set to surge to 50%, up from 10%, due in part to its legal proceedings against the country's former president Jair Bolsonaro. Canada will face 35% tariffs, up from 25%, though goods that comply with the U.S.-Mexico-Canada agreement (USMCA), which represent the significant majority of trade, will remain exempt. Most other countries will reportedly face tariffs of 15%-20%.
-
Vietnam secured a trade deal with the U.S. on July 2 that imposes a 20% levy on imported goods
originating within that country, a significant drop from the 46% figure announced in April.
The U.K. previously signed a trade agreement that charges 10% duties on exports to the U.S.
Though the sample size is small, reductions from announced tariff rates appear to be achievable,
in our view.
Tariffs are a key focus of the U.S. administration's agenda, meaning tariff rates are poised to rise significantly from the average near 2.3% at the end of 2024. Tariffs have had a limited impact on inflation thus far, as they have largely been either absorbed by the supply chain, including producers, importers, distributors and retailers, or avoided by stockpiling inventories ahead of their implementation. While the extent to which higher costs are ultimately passed along to consumers is uncertain because supply-chain dynamics are complex, we expect inflation to drift higher over the months ahead. Profit margins likely aren't sufficient across most industries to absorb tariffs of the magnitude proposed. However, these near-term price hikes that are likely not a source of ongoing inflation over the long term, in our view. Any progress in finalizing trade agreements over the coming weeks and months should help further ease trade tensions, in our view, and we think any flexibility in lowering tariffs should help contain inflation and growth risks.
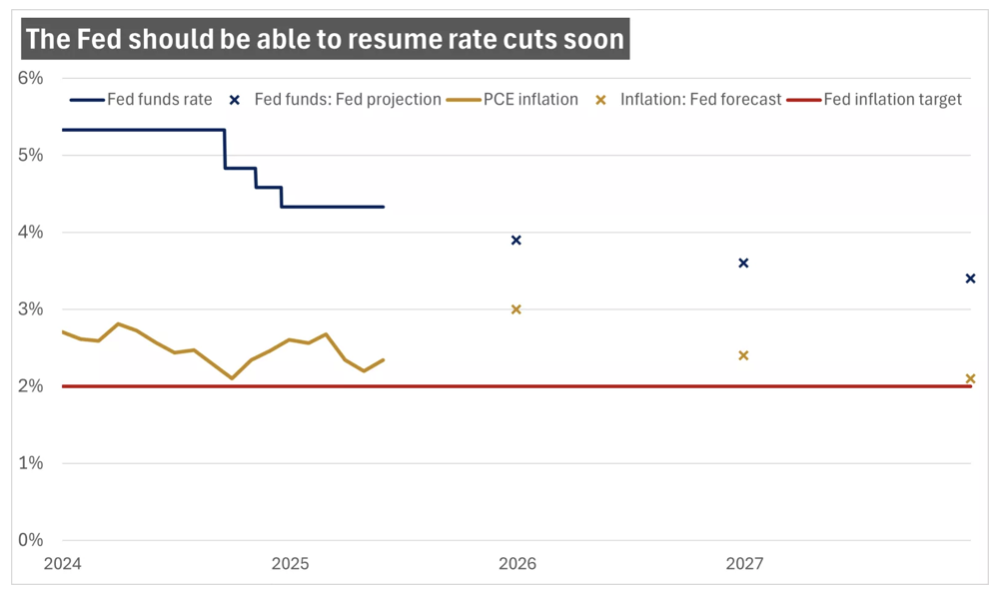
The potential stagflationary effects of tariffs — slower growth coupled with higher inflation — put the Federal Reserve in a difficult position, presenting risks to both its maximum-employment and price-stability mandates. As a result, the central bank is likely to remain on the sidelines a while longer as it seeks greater clarity on the impact of tariffs on inflation. The resilient, though cooling, labor market should allow some more time, in our view, with rate cuts likely resuming in the fall. With the fed funds rate near 4.3% and personal consumption expenditure (PCE) inflation (the Fed's preferred inflation measure) at 2.3%, monetary policy is likely restrictive. While inflation remains above the 2% target, we believe there is room for the Fed to cut interest rates into 2026, likely approaching 3% to 3.5% as inflation moderates over time.
-
While the economy is slowing, we expect a reacceleration in 2026 and 2027, supported by
tailwinds of fiscal stimulus, monetary-policy easing, and deregulation. We recommend investors
use potential volatility as opportunities. We favor U.S. large-cap and mid-cap stocks, which
we believe should perform well in this environment. The strong performance of international
stocks this year, driven in part by the pullback in the U.S. dollar, highlights the importance
of maintaining allocations beyond the U.S. However, we suggest an underweight position in
international developed-market large-cap stocks, especially given that the pace of recent
international outperformance is likely to ease from here, in our view.
Consider underweight allocations to international bonds, in part due to their lower yields, and U.S. high-yield bonds, where credit spreads are historically tight. Within U.S. investment-grade bonds, we suggest extending duration. Bonds in the seven- to 10-year range offer the opportunity to lock in yields for longer as the Fed likely resumes rate cuts, with potentially less sensitivity to deficit concerns than long-term bonds.
With U.S. stocks near all-time highs, markets may experience volatility as economic data potentially softens in the months ahead and trade tensions could persist for a while longer. However, we believe the fundamental backdrop remains intact, and pullbacks can be used as opportunities to invest at better prices or to rebalance to maintain diversification.
-
Final Words: Market indicates Extreme Greed. Buy Gold and Silver (GLD & SLV ETF's).
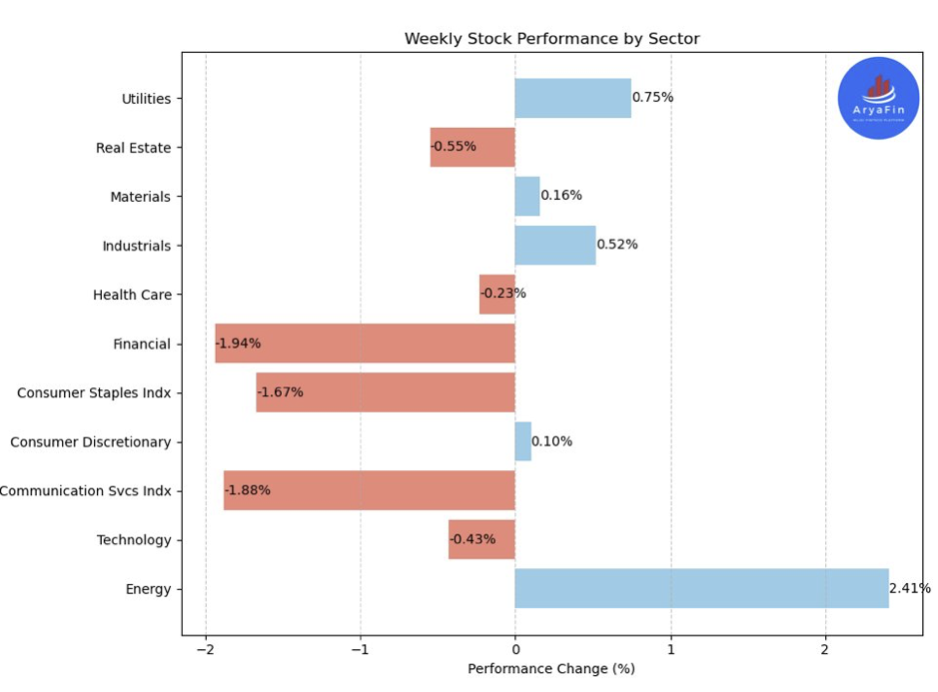
Below is last week sector performance report.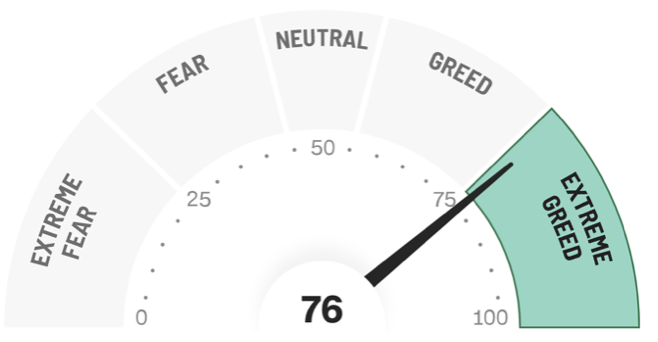
Top 11 Sector Performance for week of July 7-11, 2025: $XLE S&P Energy (2.41%)
$XLK S&P Technology (-0.43%)
$XLC Communication Services (-1.88%)
$XLY S&P Consumer Discretionary (0.10%)
$XLP S&P Consumer Staples (-1.67%)
$XLF S&P Financial (-1.94%)
$XLV S&P Health Care (-0.23%)
$XLI S&P Industrials (0.52%)
$XLB S&P Materials (0.16%)
$XLRE S&P Real Estate (-0.55%)
$XLU S&P Utilities (0.75%)
If you are looking for investment opportunities, you can take a look at our
Hidden Gems
section, and if you want to see our past performance, visit our
Past Performance section. If you are looking for
safe and low cost Exchange Traded funds(ETFs), check out our
ETF recommendations.
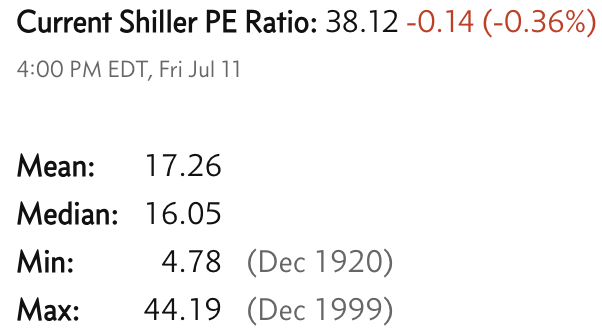
Currrent Shiller PE (see below) is showing overbought conditions as index is far above mean/media
and our AryaFin engine is indicating caution. Have a good weekend.