Weekly Market Commentary - Jan 3, 2026 - Click Here for Past Commentaries
-
As is customary this time of year, we have developed some resolutions for investors that
we hope will serve them well in 2026.
First, we recommend checking the health of the U.S. economy in early 2026, as data disruptions from last year’s government shutdown fade, to cross-check optimistic market expectations.
Second, investors should consider deploying excess cash gradually, according to their risk tolerance, investment objectives, and time horizon. With interest rates down nearly 200 basis points (2%) from their peak and expected to fall further this year, stocks and bonds may offer better returns.
Next, we believe investors should target a well-diversified portfolio of domestic and international equities to spread risk and capitalize on broadening earnings growth at home and abroad.
Finally, 2025 taught us that investors should avoid playing politics with their portfolios, as markets delivered robust returns despite a barrage of policy headlines. This lesson is worth repeating in a midterm year.
Of course, everyone’s resolutions will differ, and your financial adviser can tailor these recommendations to keep you on track toward your long-term goals.
-
We don't mean a trip to the gym. Instead, it will be important to check the temperature of the U.S.
economy early in the new year as data disruptions through late 2025 start to clear.
The government shutdown clearly affected key labor market indicators. A shuttered Bureau of Labor Statistics (BLS) was unable to publish a full labor report in October, and the agency has acknowledged that the quality of the data released for October and November was lower than normal. This aligns with ambiguous signals: private hiring seemingly improved through the fall, but the unemployment rate rose.
Against this backdrop, markets will, in our view, pay even more attention than usual to December's payrolls report, released on Friday, as it provides the first uninterrupted reading of the labor market since September. Hopefully the data will offer more clarity.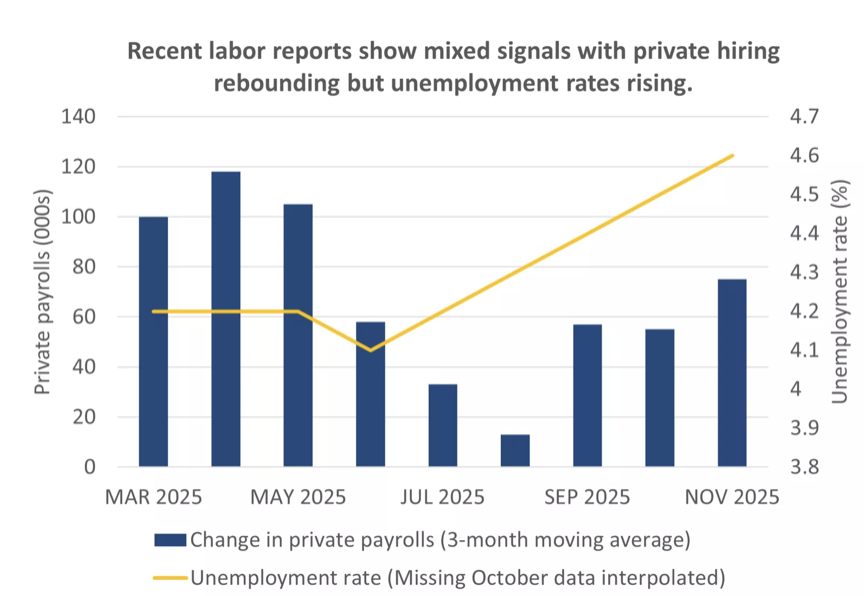
Similarly, December Consumer Price Index (CPI) data, released in mid-January, will give a cleaner read on inflation. The BLS was unable to release October figures due to missed data collection, and these issues also affected November, with a surprisingly large slowdown in inflation partly attributable to missing data.
Importantly, these data will provide an early check of market expectations for 2026. Consensus expects solid activity to underpin a broadening in corporate earnings growth, while CPI inflation is expected to hold around 3% before starting to slow later in the year. Data that corroborate these expectations are likely to be well received, but curveballs could spark an early reassessment of market pricing.
-
U.S. interest rates have fallen 175 basis points (1.75%) from their peak in 2024, and we think they
will drop further this year.
This is not a completely straightforward call, with inflation still running hot. In early 2026, it will be a full five years since price growth was at or below the Fed’s 2% target, and “several” FOMC members are uncomfortable cutting again until they see more meaningful progress, according to the December Fed meeting minutes.
However, elsewhere on the Fed’s rate-setting committee, there is more confidence in the inflation outlook. The majority expects shelter inflation to cool further, while some have highlighted that firms are reluctant to raise prices at present given softer demand. Importantly, while tariffs are expected to keep pushing goods prices higher in coming months, the Fed sounds increasingly confident that these pressures will prove temporary.
The upshot is that, barring nasty surprises, the Fed will remain inclined to cut, in our view. Markets are pricing in two 25-basis-point (0.25%) cuts this year, which would bring rates close to 3%, a level at which the Fed thinks policy is neither stimulating nor weighing on the economy. We broadly agree with this pricing and think the Fed will move once or twice more, bringing rates to the 3–3.5% range.
With the returns on cash expected to drop further, in our view, it is a good time to consider adding to strategic allocations in bonds and equities that are expected to provide notably better returns in 2026.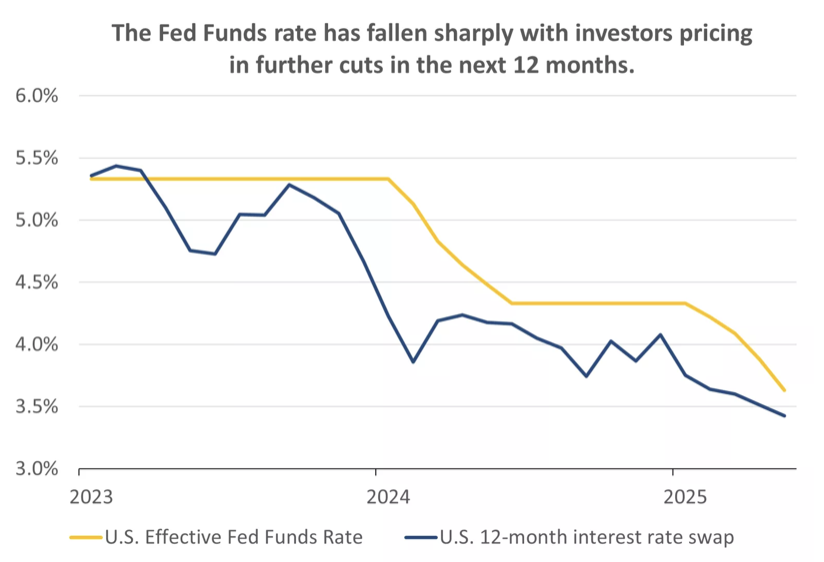
-
The scale of outperformance in U.S. mega-cap technology stocks during this bull market has been striking.
Over the past three years, the Magnificent Seven group has risen 325%, far outpacing the roughly 80% gain
in the broader S&P 500, the 40% rise in the small-cap Russell 2000, the 50% increase in the Euro Stoxx, and
the 95% increase in the Nikkei.
This run has been driven by two key forces, in our view. First, breakthroughs in AI technologies have fueled substantial earnings outperformance for these companies. Second, from a global perspective, U.S. assets have been favored due to robust domestic growth dynamics—so-called U.S. exceptionalism—which has pushed the dollar higher and widened the gap in dollar returns between domestic and international equities.
However, there are signs these forces are running out of steam.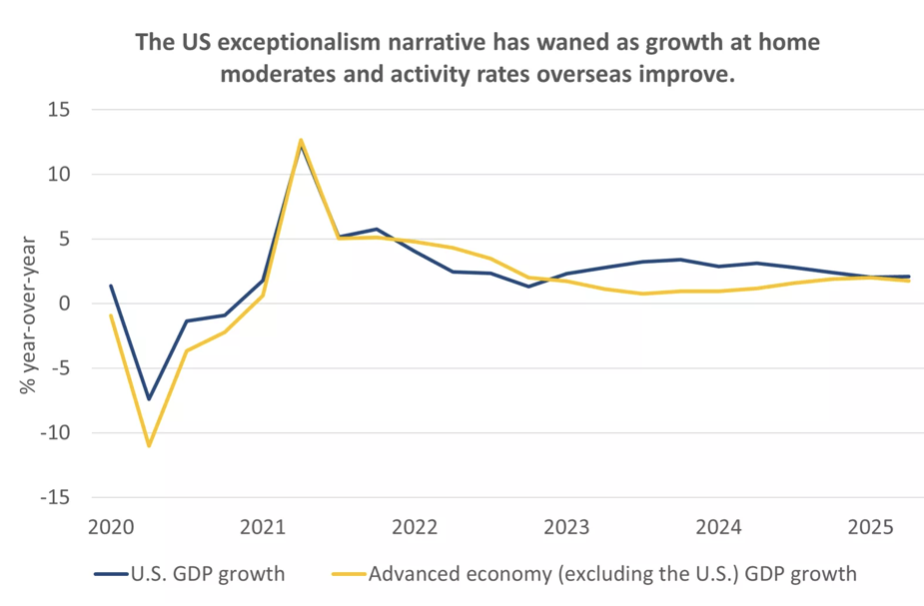
Domestically, solid earnings growth is expected across all eleven S&P sectors. While technology companies are expected to lead again, the gap with others is narrowing, with financials, consumer discretionary, and industrials all projected to generate double-digit earnings.
Internationally, the gap between U.S. and international growth has now closed, helped by improving international activity and some moderation in U.S. growth. Alongside this macro pickup, international earnings growth is expected to improve in 2026.
Finally, the dollar shifted from a headwind for international equity returns into a tailwind last year following a 10% depreciation in trade-weighted terms. We believe a flat or slightly weaker greenback strengthens the case for greater international exposure in 2026.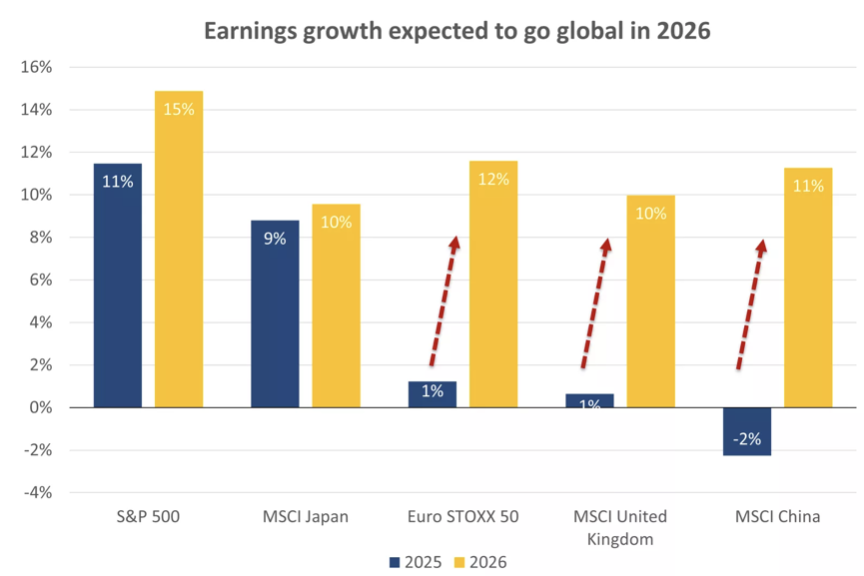
Taken together, while diversification remains a key tool in portfolio construction, we see an especially compelling case in 2026 for allocations to international developed- and emerging-market equities, alongside the attractive opportunities within U.S. large- and mid-cap stocks.
-
Politics and policy were in focus last year as the new administration introduced sweeping trade, tax, and
immigration policy changes. At times, the uncertainty triggered by these adjustments sparked sharp bouts of
market volatility, most memorably a nearly 20% correction in the S&P 500 in early April. However, despite
these wobbles, markets delivered robust returns over 2025.
We suspect there will be fewer fireworks on the policy front in the second year of this administration. On the trade side, following a large tariff reset in 2025, we expect tariffs to remain relatively stable this year, even if isolated spats arise in bilateral trade relationships. Similarly, while speculation exists about another reconciliation bill from a Republican-controlled Congress—perhaps aimed at additional fiscal stimulus—strained public finances could discourage large-scale legislation, in our view.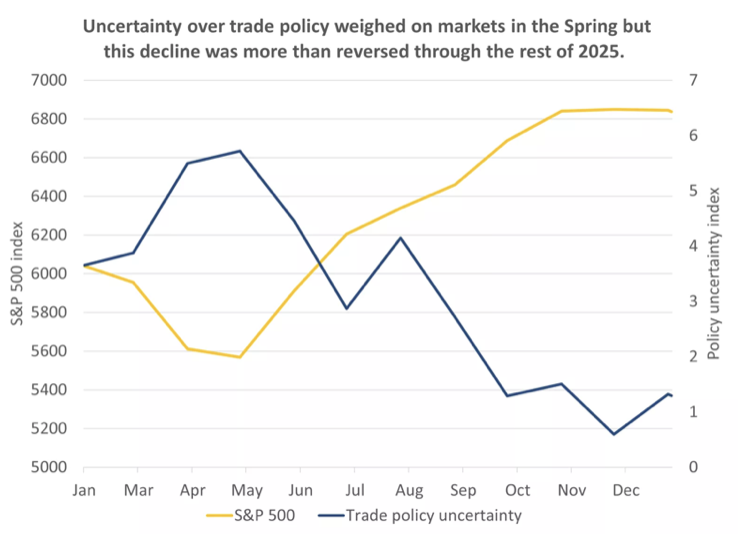
Still, we cannot rule out fireworks, particularly in a midterm year. Investors will likely watch the polls closely to see whether Republicans can maintain control of Congress or risk losing the House or Senate, which could lead to policy gridlock given the wide partisan divisions.
However, it is important not to overreact to policy noise or let personal political views dictate investment strategy. Instead, investors should focus on building a well-diversified portfolio aligned with their financial goals.
-
Final Words: Market indicates neutral.
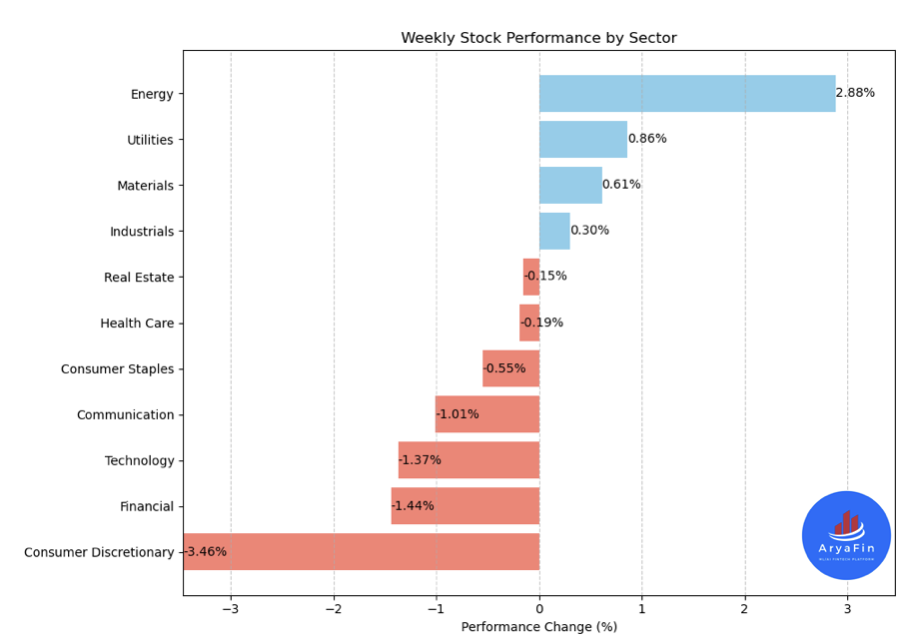
Below is last week sector performance report.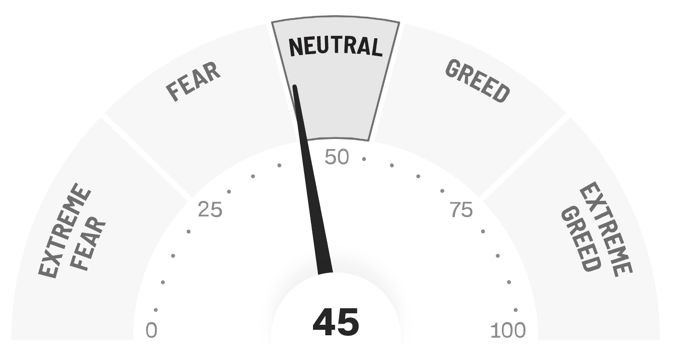
Weekly Sector Performance for Dec 29, 2025 - Jan 2, 2026:
$XLE Energy: 2.88%, RSI: 57.21
$XLK Technology: -1.37%, RSI: 49.34
$XLC Communication: -1.01%, RSI: 53.72
$XLY Consumer Discretionary: -3.46%, RSI: 43.29
$XLP Consumer Staples: -0.55%, RSI: 44.14
$XLF Financial: -1.44%, RSI: 57.60
$XLV Health Care: -0.19%, RSI: 57.06
$XLI Industrials: 0.30%, RSI: 59.15
$XLB Materials: 0.61%, RSI: 64.16
$XLRE Real Estate: -0.15%, RSI: 43.48
$XLU Utilities: 0.86%, RSI: 48.93
If you are looking for investment opportunities, you can take a look at our
Hidden Gems
section, and if you want to see our past performance, visit our
Past Performance section. If you are looking for
safe and low cost Exchange Traded funds(ETFs), check out our
ETF recommendations.
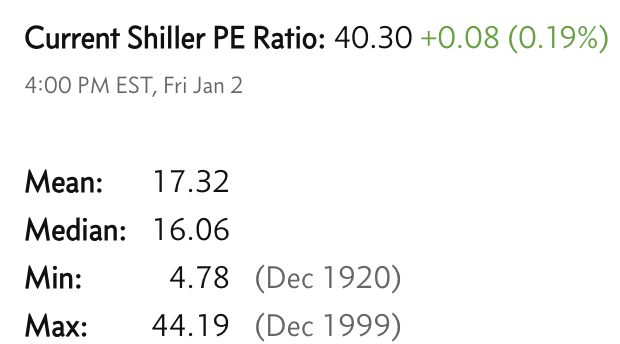
Currrent Shiller PE (see below) is showing overbought conditions as index is far above mean/media
and our AryaFin engine is indicating caution. Have a good weekend.