Weekly Market Commentary - Feb 7, 2026 - Click Here for Past Commentaries
-
The market finished a volatile first week of February 2026 with a historic milestone: the Dow Jones
Industrial Average surged over 1,200 points on Friday to close above 50,000 for the first time.
Despite this late-week rally, the broader market saw mixed results as investors navigated heavy
rotation out of tech and concerns over AI spending.
Weekly Performance Summary
While the Dow snapped a three-week losing streak, the tech-heavy Nasdaq continued to struggle, marking its fourth consecutive weekly decline.
Key Market Drivers
The AI "Gut Check": Tech stocks faced a sharp mid-week rout after Amazon and Alphabet signaled aggressive increases in AI-related capital expenditures, totaling a more than 50% jump in spending. Nvidia recovered late in the week, soaring nearly 8% on Friday as traders bet it would be the primary beneficiary of this increased spending.
Economic Signals: Labor market data showed signs of softening, with initial jobless claims rising to 231,000, a two-month high. Conversely, manufacturing activity hit its strongest growth since May 2022, and consumer sentiment improved to 57.3.
The "Warsh" Factor: Early in the week, markets reacted to the nomination of Kevin Warsh as the next Federal Reserve Chair, which initially pushed Treasury yields higher and pressured rate-sensitive sectors like industrials and software.
Sector Spotlight
* Defensive and cyclical sectors led the way as investors rotated away from high-growth tech. * Top Gainers: Consumer Staples (+6%), Industrials (+4.7%), and Energy (+4.3%). * Top Losers: Consumer Discretionary (-4.6%) and Telecommunications (-4.4%).
Individual Movers:
Stellantis plummeted 25% following a business reset and a $26 billion charge, while Molina Healthcare fell 26% on a disappointing 2026 forecast.
-
Final Words: Market indicates Greed. No New Buys
Below is last week sector performance
report.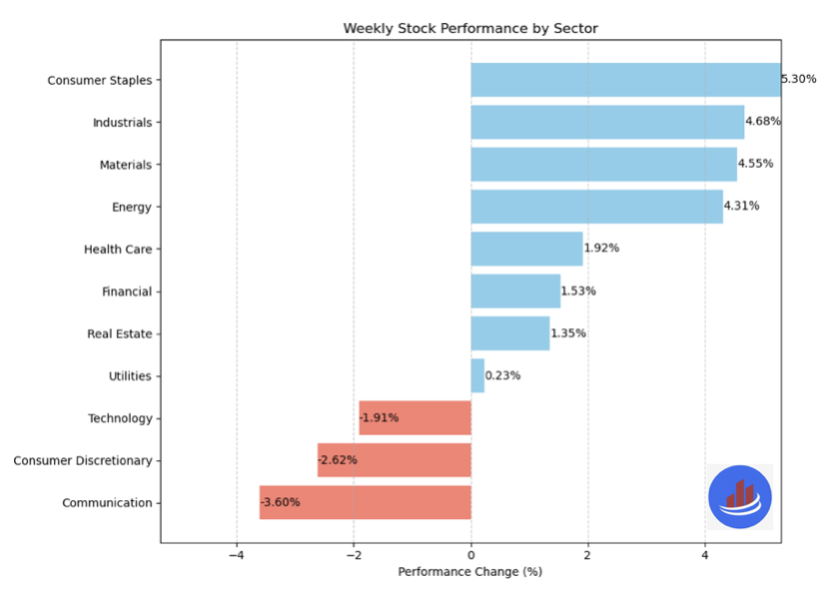
If you are looking for investment opportunities, you can take a look at our
Hidden Gems
section, and if you want to see our past performance, visit our
Past Performance section. If you are looking for
safe and low cost Exchange Traded funds(ETFs), check out our
ETF recommendations.
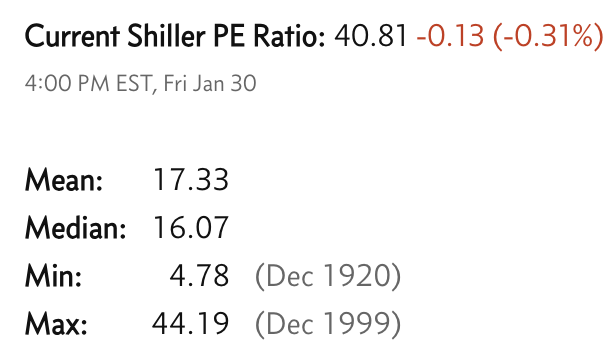
Currrent Shiller PE (see below) is showing overbought conditions as index is far above mean/media
and our AryaFin engine is indicating caution. Have a good weekend.