Weekly Market Commentary - Feb 14, 2026 - Click Here for Past Commentaries
-
For the week ending Friday, February 13, 2026, U.S. stock markets posted their largest weekly losses
of the year as intense concerns over AI-driven industry disruption overshadowed positive economic data.
Key Market Drivers
* The "AI Jitters": A new AI automation tool sparked a massive $285 billion rout mid-week, causing investors to dump shares in software, financial services, and logistics sectors over fears of business model displacement.
* Inflation Relief: Friday's Consumer Price Index (CPI) report offered some relief, showing headline inflation slowed to 2.4% in January—its lowest reading since mid-2021.
* Mixed Jobs Data: The delayed January payrolls report showed modest labor strength with 50,000 jobs added and the unemployment rate ticking down to 4.3%, though private-sector growth was slower than expected.
* Corporate Moves: Kroger named a former Walmart executive its new CEO, while Kyndryl shares nosedived 55% following a slashed outlook and SEC document requests.
Fixed Income & Commodities
* Treasury Yields: The 10-year Treasury yield slipped to 4.20% as investors sought safety in core bonds.
* Crypto & Gold: Bitcoin remained volatile, trading near $70,800 after nearly falling to $60,000 mid-week. Gold futures rebounded to finish at $5,100 per ounce.
Sector Performance Details
* Software (-1.43% week / -20% YTD): A historic "AI freakout" erased nearly $2 trillion in market cap from this sector in early February. Investors fear that new AI "agents" (like Anthropic’s legal plugins and OpenAI's "Frontier") could cannibalize traditional SaaS business models. - Hardest Hit: Atlassian (-47% YTD), Intuit (-40% YTD), and Salesforce (-30% YTD).
* Financial Services (-4.85% week): The sell-off spread here as AI tools for tax planning and wealth management began threatening traditional brokerage fees. - Hardest Hit: LPL Financial (-12.2%) and Charles Schwab (-10.8%).
* Utilities (+7.07% week / +8% YTD): The top-performing sector this week, reaching its best start to a year in 25 years. Investors are betting on the massive electricity demand required to power AI data centers. - Top Gainers: Constellation Energy (+10.3%) and Entergy.
* Energy (+1.67% week / +21% YTD): Energy remains the undisputed market leader for 2026, benefiting from a "tectonic shift" as capital seeks tangible cash flows over tech speculation.
Weekly Sector Performance for Feb 9-13, 2026:
$XLE Energy: 2.07%, RSI: 71.65
$XLK Technology: -1.11%, RSI: 42.87
$XLC Communication: -1.02%, RSI: 40.64
$XLY Consumer Discretionary: -1.53%, RSI: 34.82
$XLP Consumer Staples: 1.79%, RSI: 80.50
$XLF Financial: -4.81%, RSI: 34.75
$XLV Health Care: -0.03%, RSI: 55.48
$XLI Industrials: 0.57%, RSI: 69.09
$XLB Materials: 3.49%, RSI: 69.99
$XLRE Real Estate: 3.60%, RSI: 71.80
$XLU Utilities: 7.27%, RSI: 77.72
-
Final Words: Market indicates Greed. No New Buys
Below is last week sector performance
report.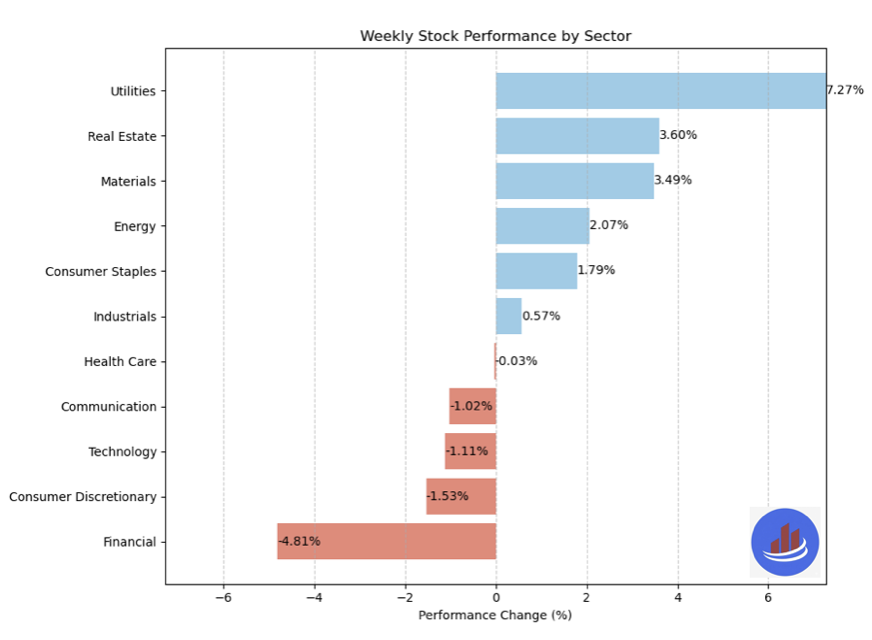
If you are looking for investment opportunities, you can take a look at our
Hidden Gems
section, and if you want to see our past performance, visit our
Past Performance section. If you are looking for
safe and low cost Exchange Traded funds(ETFs), check out our
ETF recommendations.
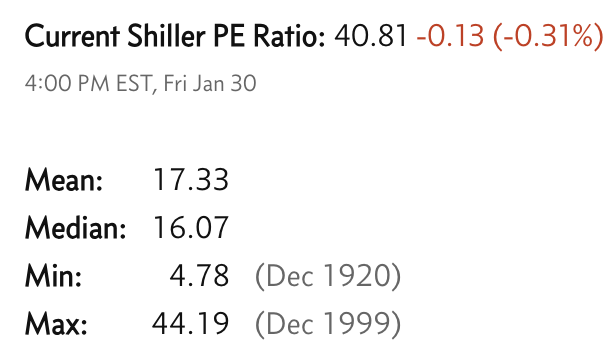
Currrent Shiller PE (see below) is showing overbought conditions as index is far above mean/media
and our AryaFin engine is indicating caution. Have a good weekend.