Weekly Market Commentary - Dec 6, 2025 - Click Here for Past Commentaries
-
As we enter the final weeks of 2025, markets have delivered double-digit gains across all major U.S. indexes.
We are watching three key catalysts heading into 2026:
December Fed meeting: In our view, the Federal Reserve is likely to cut interest rates at its December meeting, aiming to bring rates to a neutral level (3.0%–3.5%) amid contained inflation and a softer near-term economic outlook.
Labor market in focus: The November U.S. nonfarm payrolls report (due December 16) will provide clarity on labor conditions, with forecasts calling for slower job growth and a slight uptick in unemployment, though real wage growth remains positive.
Will Santa Claus come to town? Investors are watching for a potential Santa Claus rally, which historically occurs 73% of the time in late December. In preparation for 2026, we recommend solidifying your rebalancing and diversification strategies to keep your portfolio aligned with your intended allocations.
-
Stock markets began December on a positive note, with the S&P 500 rising modestly for the week. Year-to-date,
the S&P 500 is up about 17%, while the technology-heavy Nasdaq is up a solid 22%.
With just a few weeks left in 2025, here are three key data points we’re watching to guide us into year-end and 2026: the December Federal Reserve meeting, the November U.S. nonfarm payrolls report, and whether a Santa Claus rally materializes at the end of December.
-
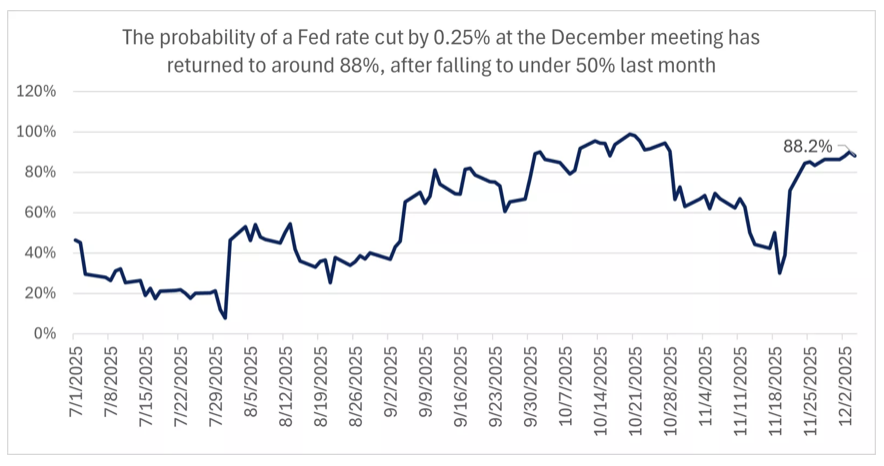
Perhaps the biggest catalyst between now and year-end is the Federal Reserve meeting on December 9-10. Investors
will receive not only an interest rate decision, but also updated economic projections and the Fed's "dot plot,"
which shows where committee members expect rates to head over the next three years.
We believe the Fed will likely cut rates next week and is on track to bring the fed funds rate toward a neutral level of 3.0%-3.5% in the year ahead. Importantly, these cuts aim to return rates to neutral, not because a recession is imminent. Historically, when the Fed cuts rates while the economy remains solid, stocks perform well; when cuts are driven by economic weakness, markets tend to suffer.
While we expect trend growth next year, the near-term outlook is softer. The October government shutdown modestly slowed activity, likely leading to weaker Q4 GDP. Labor market data has also been incomplete since the shutdown, but the picture remains mixed (see below). In our view, the Fed will not want to risk further labor market deterioration or allow a temporary Q4 slowdown to become prolonged.
Another supportive factor is that inflation has stayed contained in the 2.5%-3.0% range. Last week's Michigan survey, for example, showed one-year inflation expectations dropping from 4.5% to 4.1%—further evidence that higher inflation is not yet entrenched. All of this points to a Fed likely to continue its rate-cutting cycle at next week's December meeting.
-
The second data point to watch in December is the first complete reading of the U.S. nonfarm jobs report
since the government shutdown began in early October. On December 16, investors will receive the November jobs
report, which should help clarify the state of the U.S. labor market.
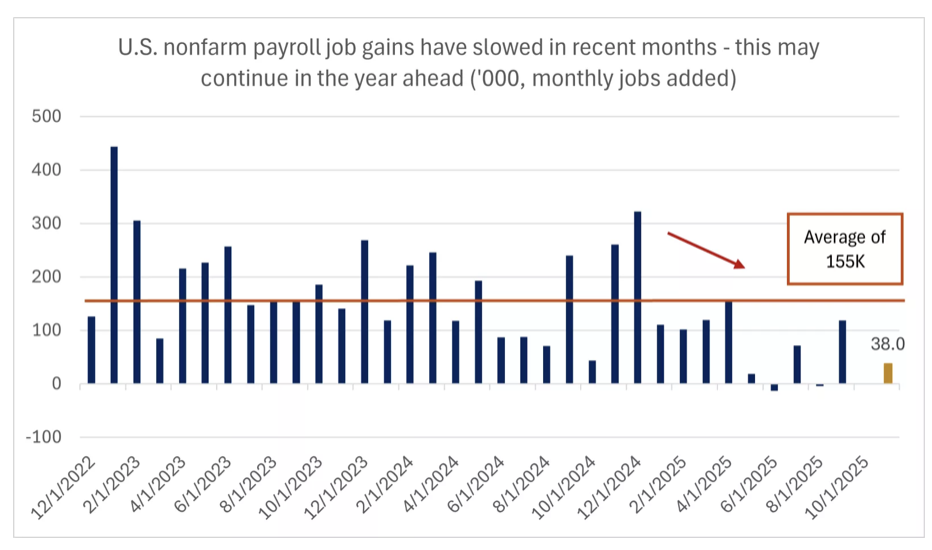
Expectations for the November report remain relatively soft. Forecasts call for 38,000 jobs added, well below September’s 119,000. The unemployment rate is expected to rise from 4.4% to 4.5%, while year-over-year wage growth is projected to slow from 3.8% to 3.6%. Notably, wage growth should still outpace inflation, delivering positive real wages to households.
Overall, U.S. labor market data has been mixed, but the broader trend shows slower labor demand and constrained supply. On the demand side, employers have eased hiring, job openings have declined, and ADP private payrolls showed negative job gains last month. However, weekly jobless claims have remained steady and even fell last week, indicating the labor market is not on the verge of rapid deterioration.
On the supply side, pressures stem from an aging demographic, stagnant labor force participation, and ongoing immigration restrictions. In our view, lower demand and supply should keep the unemployment rate contained, but investors will likely need to accept lower average monthly job gains in nonfarm payrolls as the new normal.
-
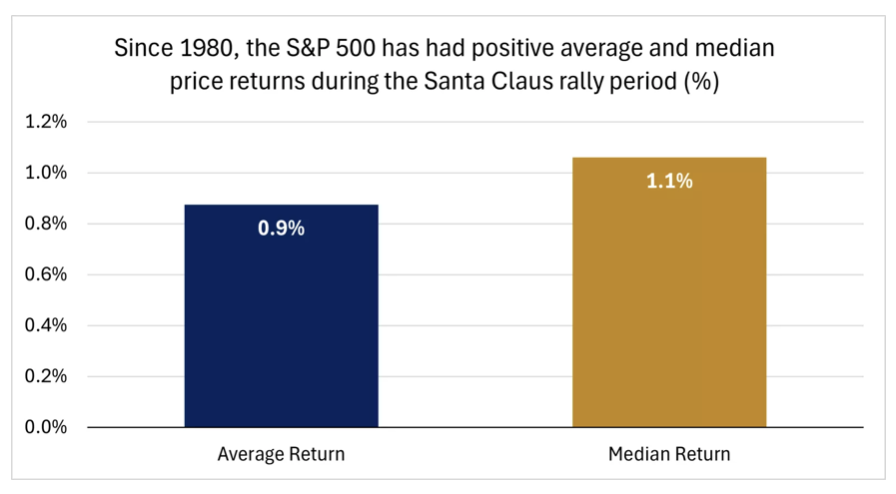
Finally, the third catalyst to watch in December is whether the Santa Claus rally will materialize for investors
again this year. Historically, December has been a strong month for the stock market. The "Santa Claus rally"—the
last five trading days of the year plus the first two of January—has been positive 73% of the time since 1980,
with an average S&P 500 gain of 1.1%.
More broadly, the stock market has enjoyed a strong run since the April lows, with the S&P 500 up about 38% and
only one 5% pullback in November*. As year-end approaches, investors are likely thinking about positioning for
the year ahead. After three years of gains, a 60/40 stock-bond portfolio may now be closer to 70% stocks or more.
- As we enter the final weeks of the year, we are closely watching the Fed meeting, labor market data, and stock market seasonality. In addition to rebalancing portfolios, we recommend that investors increase market diversification in 2026 to avoid overconcentration risks. We favor U.S. large-cap stocks, which offer exposure to AI and technology themes, alongside U.S. mid-cap stocks, which are more tilted toward cyclical sectors and have catch-up potential, especially as the Federal Reserve considers lowering interest rates. We also recommend global exposure, including emerging-market equities, which can perform well when the Fed cuts rates and provide access to global technology themes, as well as international small- and mid-cap stocks, which offer relatively attractive valuations. Finally, we remain equal-weight on growth and value, believing that value and cyclical styles can perform well alongside tech and AI in the year ahead.
-
Final Words: Market indicates fear. Buy VOO, VGT, and GLD (Gold).
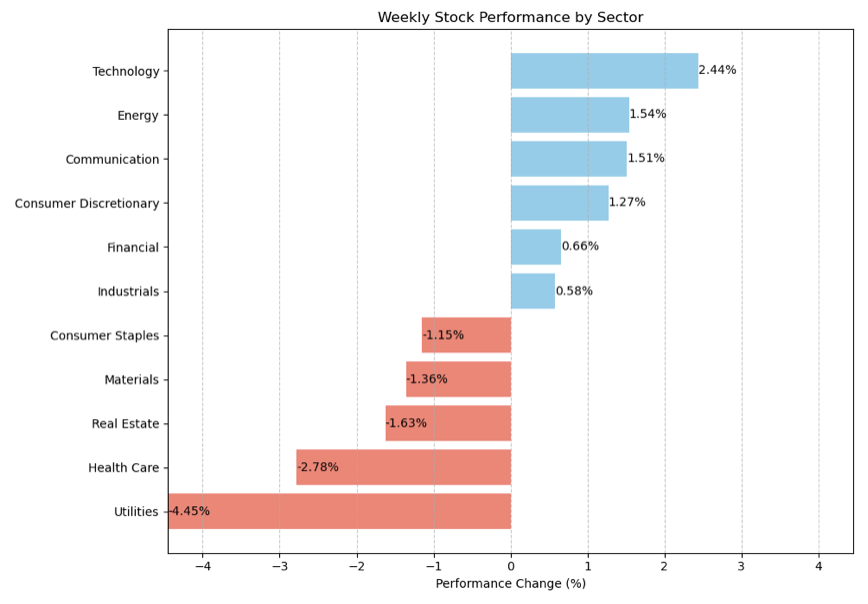
Below is last week sector performance report.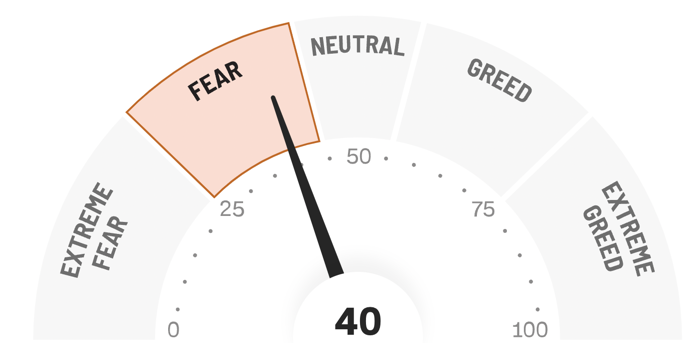
Weekly Sector Performance for Dec 1-5, 2025:
$XLE Energy: 1.54%, RSI: 58.66
$XLK Technology: 2.44%, RSI: 58.61
$XLC Communication: 1.51%, RSI: 64.08
$XLY Consumer Discretionary: 1.27%, RSI: 58.43
$XLP Consumer Staples: -1.15%, RSI: 53.97
$XLF Financial: 0.66%, RSI: 60.01
$XLV Health Care: -2.78%, RSI: 55.58
$XLI Industrials: 0.58%, RSI: 56.65
$XLB Materials: -1.36%, RSI: 52.98
$XLRE Real Estate: -1.63%, RSI: 47.07
$XLU Utilities: -4.45%, RSI: 36.67
If you are looking for investment opportunities, you can take a look at our
Hidden Gems
section, and if you want to see our past performance, visit our
Past Performance section. If you are looking for
safe and low cost Exchange Traded funds(ETFs), check out our
ETF recommendations.
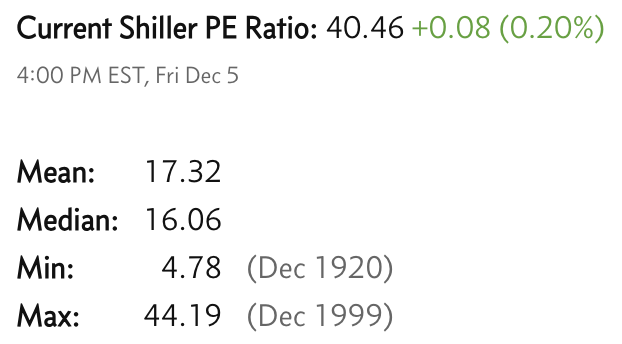
Currrent Shiller PE (see below) is showing overbought conditions as index is far above mean/media
and our AryaFin engine is indicating caution. Have a good weekend.