Weekly Market Commentary - Dec 20, 2025 - Click Here for Past Commentaries
-
Noisy but encouraging data: Inflation and labor reports were heavily distorted by the government shutdown but still point
toward moderating wage pressures, easing inflation, and a gradually stabilizing labor market.
Fed bias toward easing in 2026: With wage growth cooling and hiring softening—not sharply, but enough to matter—the Fed is
likely to maintain a gradual easing bias next year.
Market leadership may broaden: Elevated tech valuations, improving liquidity, and better earnings momentum across cyclicals,
mid-caps, and international equities support a potential rotation beyond mega-caps.
Portfolio positioning: A balanced approach is favored, with neutral tech exposure, broader equity diversification, benchmark-neutral
bond duration, and a review of excess cash as yields drift lower.
As the year winds down, the delayed U.S. employment and inflation reports delivered the final major data points before investors
step back from the constant drumbeat of market headlines and enjoy some holiday cheer. While these numbers warrant a healthy dose
of skepticism, even in their imperfect form they reinforce a constructive market outlook. They may also offer an early indication
that the rotation in market leadership seen beneath the surface in recent months could have staying power as we look ahead to
2026.
-
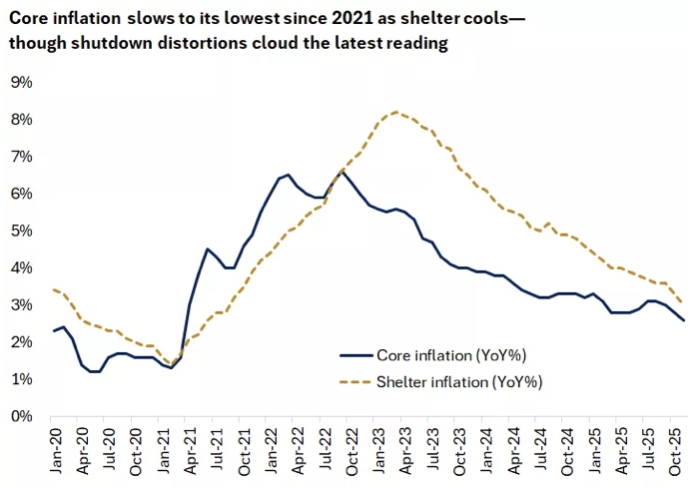
As far as surprises go, the November inflation report delivered a big one. The Bureau of Labor Statistics (BLS) announced that
headline CPI slowed to 2.7% last month from 2.8%, while core CPI, which excludes volatile food and energy components, eased to
3.1% from 3.2%. The latter is now rising at its slowest pace since 2021, and both measures came in below every economist’s
estimate.
But there is a major caveat. Due to the government shutdown, the BLS was unable to collect a significant portion of October price data and therefore had to make assumptions about the prior month's inflation levels. Most notably, shelter inflation—which represents one-third of CPI and normally moves gradually—showed an unusually sharp cooling. It appears the BLS assumed 0% housing inflation in October due to the missing data.
In our view, these distortions overstate the true extent of the inflation slowdown, meaning it may take another month or two before investors and the Fed get a clearer read on underlying price pressures. Still, we expect ongoing housing disinflation to gradually pull services inflation lower through 2026. A sharper deceleration would be a welcome upside surprise, but our base case remains that inflation holds rangebound in the first half of the year and stays above the Fed’s 2% target in 2026, albeit with modest improvement compared to 2025 levels.
-
As far as surprises go, the November inflation report delivered a big one. The Bureau of Labor Statistics (BLS) announced that
headline CPI slowed to 2.7% last month from 2.8%, while core CPI, which excludes volatile food and energy components, eased to
3.1% from 3.2%. The latter is now rising at its slowest pace since 2021, and both measures came in below every economist’s estimate.
But there is a major caveat. Due to the government shutdown, the BLS was unable to collect a significant portion of October price data and therefore had to make assumptions about the prior month's inflation levels. Most notably, shelter inflation—which represents one-third of CPI and normally moves gradually—showed an unusually sharp cooling. It appears the BLS assumed 0% housing inflation in October due to the missing data.
In our view, these distortions overstate the true extent of the inflation slowdown, meaning it may take another month or two before investors and the Fed get a clearer read on underlying price pressures. Still, we expect ongoing housing disinflation to gradually pull services inflation lower through 2026. A sharper deceleration would be a welcome upside surprise, but our base case remains that inflation holds rangebound in the first half of the year and stays above the Fed’s 2% target in 2026, albeit with modest improvement compared to 2025 levels.
-
Fed Chair Powell had already cautioned against over-interpreting the latest data due to shutdown-related distortions. This helps
explain why bond-market expectations for rate cuts did not shift materially after last week’s data releases. Still, the latest
inflation and labor trends may provide additional justification for dovish members to advocate for further easing in 2026.
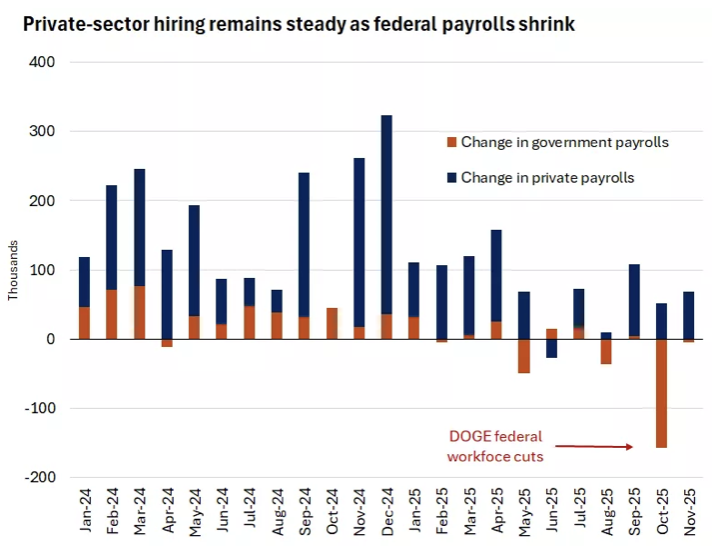
Wage growth moderated to 3.5% in November, the slowest since 2021, helping contain inflation pressures. Meanwhile, labor market softness—though not recessionary—should keep the Fed in easing mode next year, albeit with a shallower cutting cycle than in past slowdowns.
We think easier Fed policy alongside a still-solid economy has meaningful implications for both equity and fixed-income positioning, especially as leadership dynamics begin to shift.
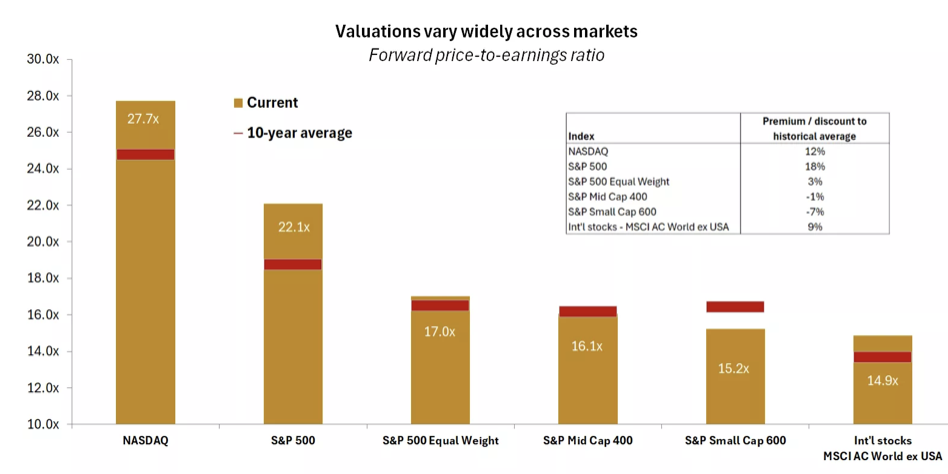
Heading into the new year, we see a backdrop of slightly looser Fed policy, modest fiscal stimulus tied to the new tax bill, fading tariff uncertainty, and steady economic growth. Combined with elevated tech valuations and accelerating earnings growth across the rest of the market, we believe this environment sets the stage for market leadership to broaden after years of concentration.
Since early November, investors have begun rotating away from the dominant large-cap technology names that have led since the start of the bull market in 2022. AI should remain a powerful tailwind, but concerns about the pace of spending, return on investment, rising debt issuance, and potential overbuilding are triggering what we view as a healthy pause in the most expensive segments of the market.
Meanwhile, a potential sustained pickup in productivity—thanks in part to AI—may help boost profitability in areas that have lagged. Cyclical sectors, small- and mid-cap companies, value-style investments, and international equities all trade near average valuations relative to their own histories and stand to benefit from improved liquidity and better credit availability. Since November, the equal-weight S&P 500 has outperformed the market-cap-weighted index by roughly 3%, a potentially constructive sign of healthier breadth heading into 2026.
The upshot: we expect markets to broaden—both within tech and beyond—with solid earnings contributions across sectors and regions, favoring a balanced portfolio approach.
-
Uncertainties remain, and the data fog may take time to clear, but the economic and market backdrop still supports another
year of positive returns in 2026 in our view—even if market leadership shifts. Here are four actions we recommend investors consider
heading into the new year:
Maintain exposure to innovation and AI, but spread risk
We recommend a neutral, benchmark-weight position in the tech sector and a 50/50 balance between growth and value to reduce concentration risk while retaining exposure to the AI structural theme.
Broaden your opportunity set to include mid-caps, cyclicals, and international equities
We favor U.S. mid-caps, international small- and mid-cap stocks, as well as emerging-market equities, where valuations remain more reasonable and earnings momentum is improving.
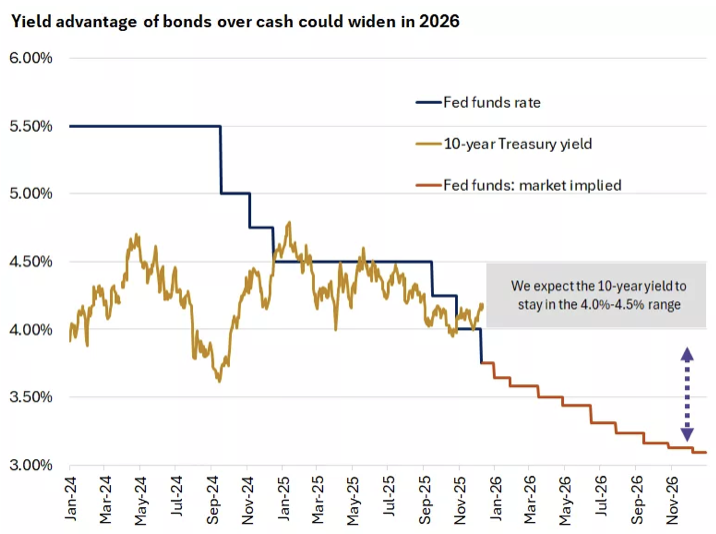
Use bonds for still-attractive income and portfolio stability
Even after recent declines, 10-year Treasury yields remain near the high end of their post-2008 range, offering compelling income opportunities*. We recommend maintaining benchmark-neutral duration for bond exposure.
Review excess cash allocations as yields decline with Fed rate cuts
With cash yields likely to drift lower, consider whether some cash could work harder elsewhere. Depending on your goals and risk tolerance, that may mean adding to high-quality bonds or increasing equity exposure.
-
Final Words: Market indicates neutral. No buys.
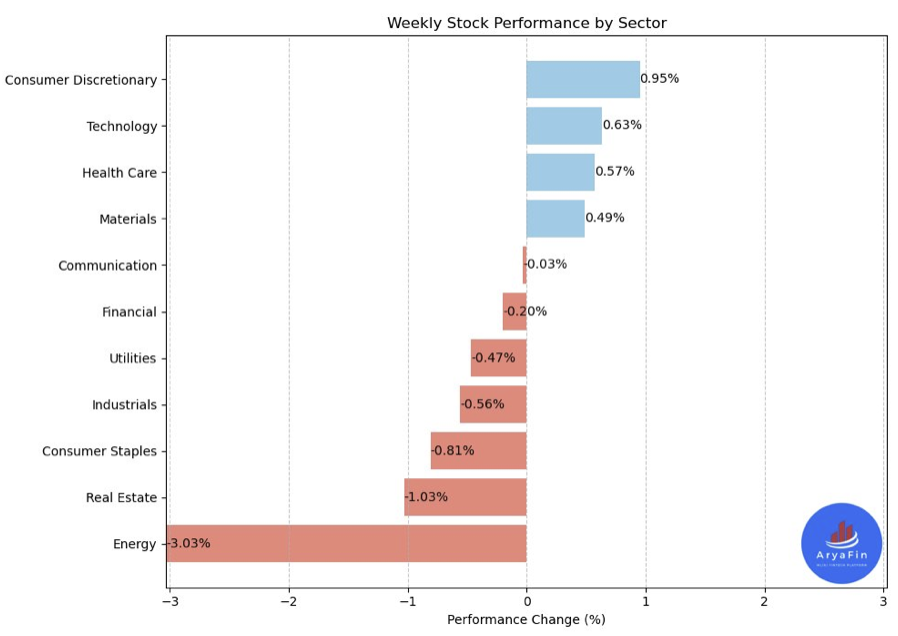
Below is last week sector performance report.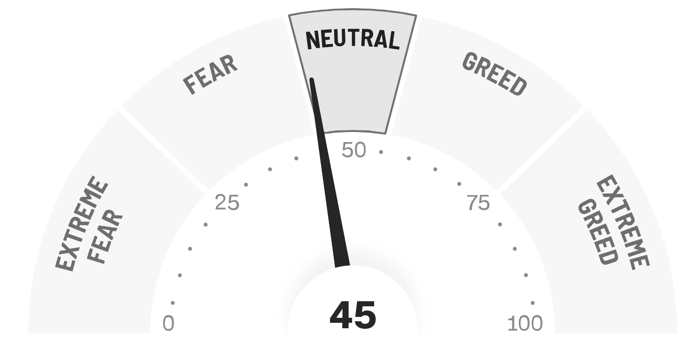
Weekly Sector Performance for Dec 15-19, 2025:
$XLE Energy: -3.03%, RSI: 43.39
$XLK Technology: 0.63%, RSI: 51.82
$XLC Communication: -0.03%, RSI: 57.49
$XLY Consumer Discretionary: 0.95%, RSI: 60.33
$XLP Consumer Staples: -0.81%, RSI: 52.48
$XLF Financial: -0.20%, RSI: 64.62
$XLV Health Care: 0.57%, RSI: 57.48
$XLI Industrials: -0.56%, RSI: 55.41
$XLB Materials: 0.49%, RSI: 62.85
$XLRE Real Estate: -1.03%, RSI: 39.96
$XLU Utilities: -0.47%, RSI: 37.98
If you are looking for investment opportunities, you can take a look at our
Hidden Gems
section, and if you want to see our past performance, visit our
Past Performance section. If you are looking for
safe and low cost Exchange Traded funds(ETFs), check out our
ETF recommendations.
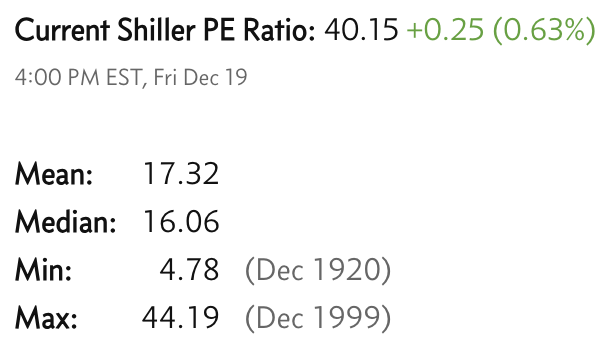
Currrent Shiller PE (see below) is showing overbought conditions as index is far above mean/media
and our AryaFin engine is indicating caution. Have a good weekend.